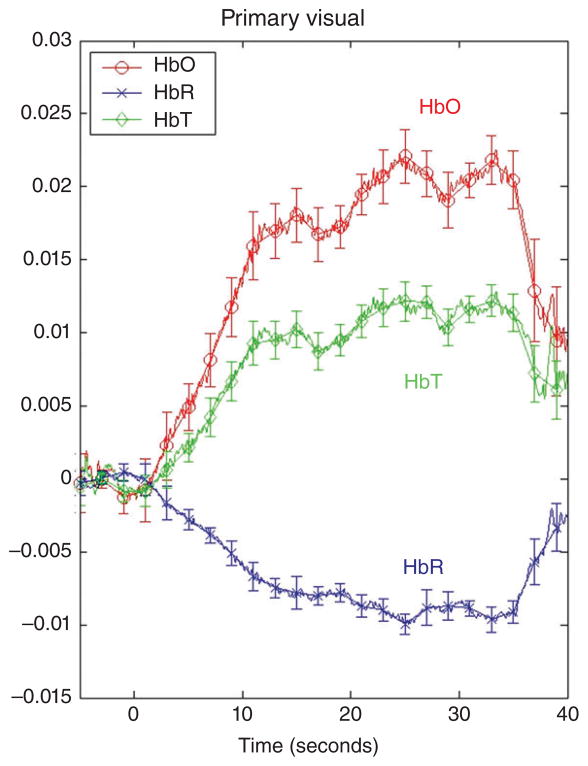
FIGURE 1.
Mean change in HbO, HbR, and HbT in the primary visual cortex in response to a visual event. (Reprinted with permission from Wilcox et al.40). The visual event was an occlusion sequence involving a green dotted ball and a red studded box. On the y-axis are relative optical density units and on the x-axis is time: −5 to 0 is the pre-stimulus baseline, 1–30 seconds is the visual event, and 31–40 seconds is the post-stimulus baseline. Relative changes in HbO, HbR, and HbT, averaged over 10–30 seconds of the test trial, were compared to 0. All responses (HbO, HbR, and HbT) differed significantly from 0 (P < .01)

