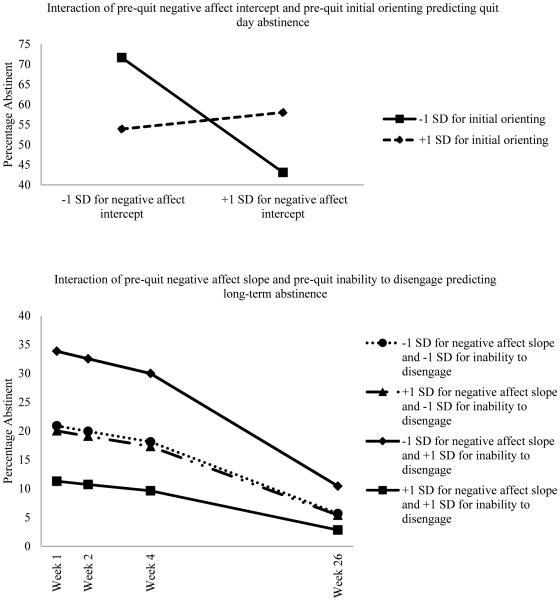
Figure 1.
Abstinence analyses using pre-quit variables as predictors. Top panel: Quit day abstinence plotted at −1 SD below and +1 SD above the mean for pre-quit negative affect intercept and at −1 SD below and +1 SD above the mean for pre-quit initial orienting. Bottom panel: Long-term abstinence plotted at −1 SD below and +1 SD above the mean for pre-quit negative affect slope and at −1 SD below and +1 SD above the mean for pre-quit inability to disengage.

