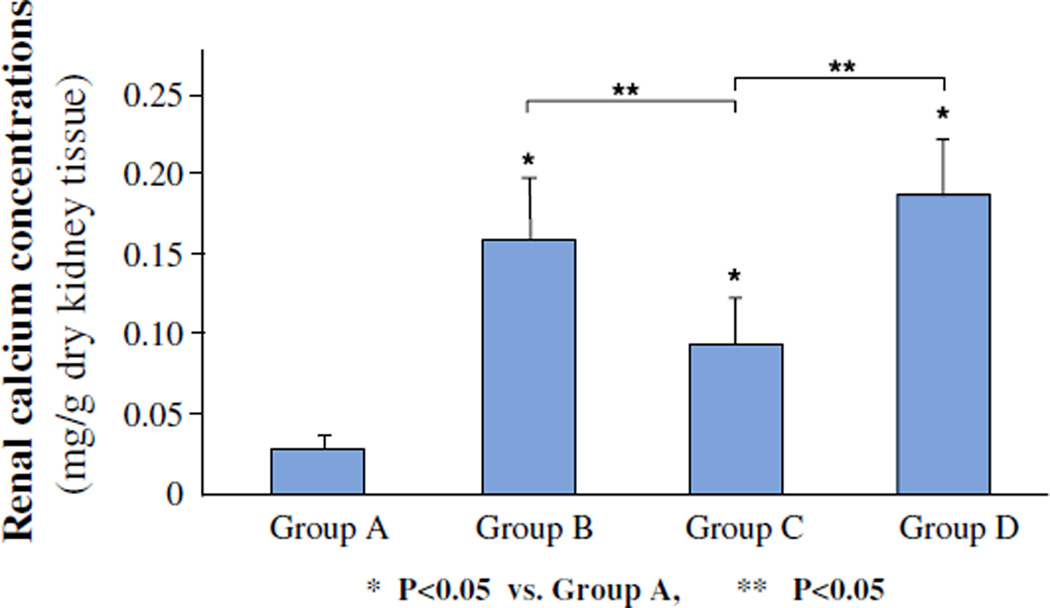
Fig. 4.
Concentration of calcium in kidneys as measured by atomic absorption spectrophotometry. A Control, B ethylene glycol, C ethylene glycol plus OPN siRNA, D negative control. Renal calcium concentration was high in kidneys of rats of group B compared to those of group C (P < 0.05). There was no difference in calcium concentration in kidneys of rats belonging to groups B and D

