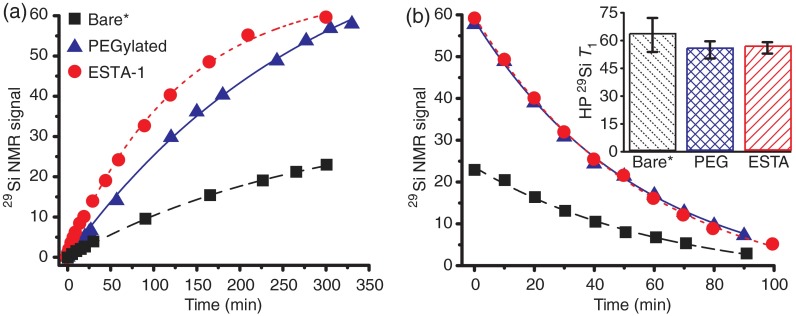
Fig. 5.
Plots of hyperpolarized NMR signal (normalized by sample mass) buildup (a) and decay (b) for samples with different surface chemistries: “Bare” particles (black squares), as well as those with added PEG (blue triangles) and ESTA-1 (red circles) functionalities coupled to the particle surface. Inset: HP values for the three particle types, calculated from decay rates in (b). *Bare data taken 2 months after other data; during that time the Q of the NMR coil drifted, contributing to the lower overall signal of the “Bare” data (but without affecting the buildup/decay rates). Hyperpolarization buildup and decay rates very similar across datasets; slight increase in buildup rate for ESTA-1 particles and slightly longer for bare particles noticed.

