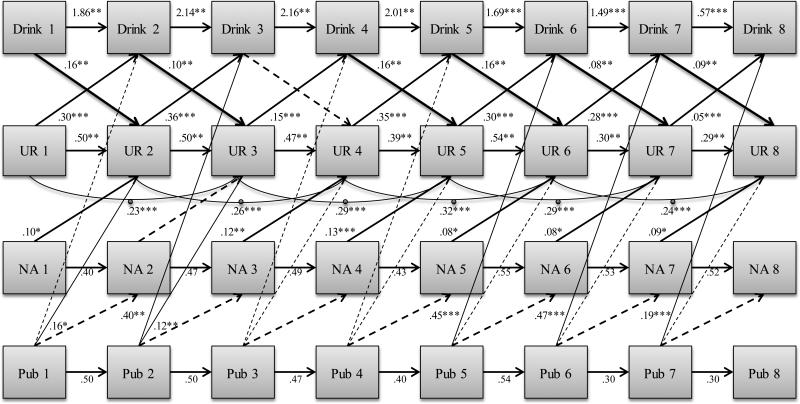
Figure 1. Reciprocal model between drinking frequency, urgency, negative affect, and puberty at all waves.
Note. UR 1 = Urgency at Wave 1, Drink 1 = drinking behavior at Wave 1, NA 1 = negative affect at Wave 1, Pub 1 = pubertal status at Wave 1. Bolded lines represent significant pathways of the main hypothesis test: drinking leading to urgency change; solid lines represent significant pathways; dashed lines represent non-significant pathways; curved lines with points represent autoregressive pathways predicting urgency from urgency scores two waves prior. Predictions from negative affect at each wave to drinking behavior at the subsequent waves were included in the model test but none of those pathways were significant, and are therefore not included in this figure. Tables S-5 to S-7 of the online supplement provides 95% confidence intervals for each of the path estimates. * p < .01 ** p < .01 *** p < .001.

