Figure 4.
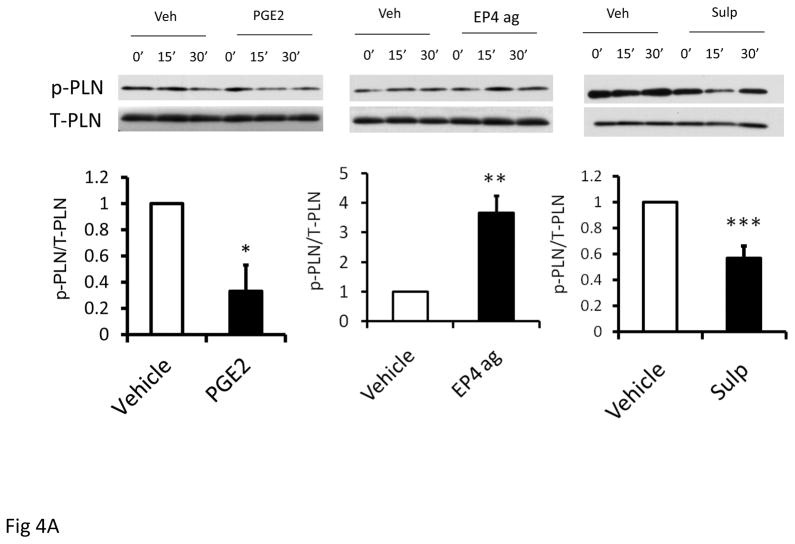
Figure 4A. Effect of PGE2(10−6M), sulprostone(10−6M) and EP4 agonist, CAY 10598 (10−6M) on p-PLN expression in isolated myocytes obtained from C57Bl/6 mice. Upper panels show representative western blots of phosphorylated and total PLN (p-PLN, T-PLN) and bottom panel is bar graph showing mean data after 15 min treatment. Statistical significance: *p<0.05, **p<0.01,***p<0.005. n=3 per group.
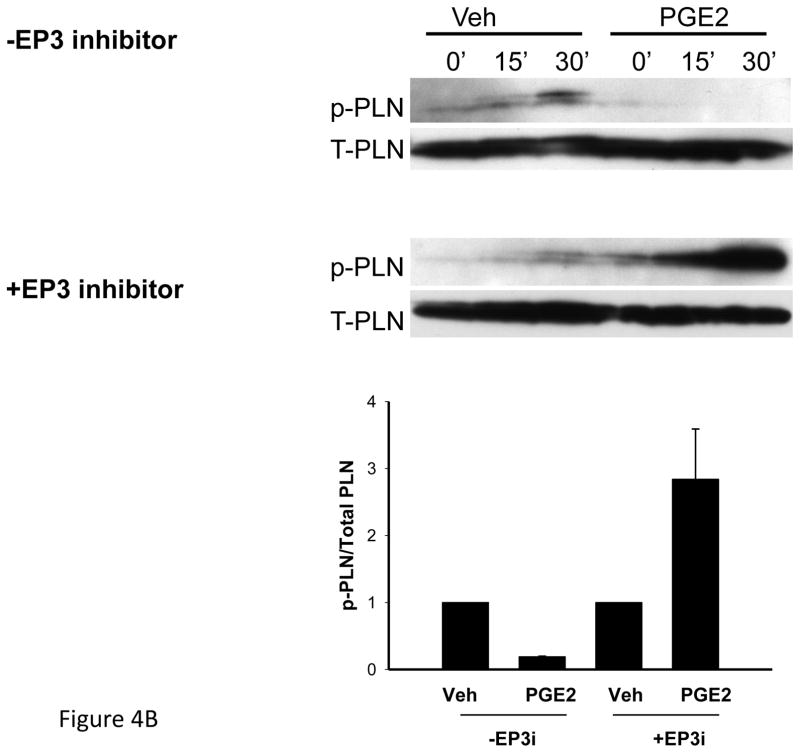
Figure 4B. Effect of PGE2 (10−6M) on p-PLN expression in isolated myocytes obtained from 13–15 week old EP4 KO mice. Experiments were performed in the absence or presence of the EP3 inhibitor (EP3i), L798, 106 (10−6M). Upper panels show representative western blots of phosphorylated and total PLN (p-PLN, T-PLN) and bottom panel is bar graph showing mean data after 15 min treatment.


