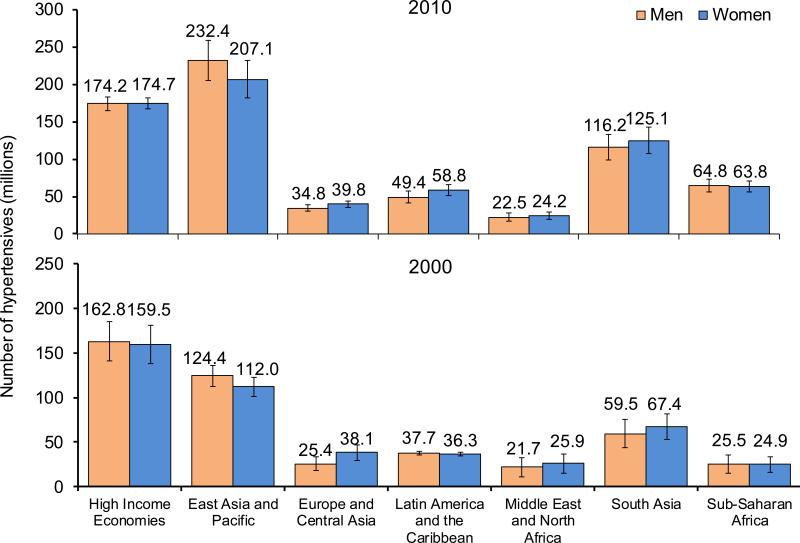
Figure 4. Absolute burden of hypertension in adults 20 years and older by world region and sex.
Upper panel shows number of hypertensive individuals in millions by world region and sex in 2010 and lower panel shows number of hypertensive individuals in millions by world region and sex in 2000. Comparisons between 2010 and 2000 absolute numbers were statistically significant (p<0.05) for men and women in East Asia and Pacific, Latin America and the Caribbean, South Asia, and Sub-Saharan Africa and for men in Europe and Central Asia.

