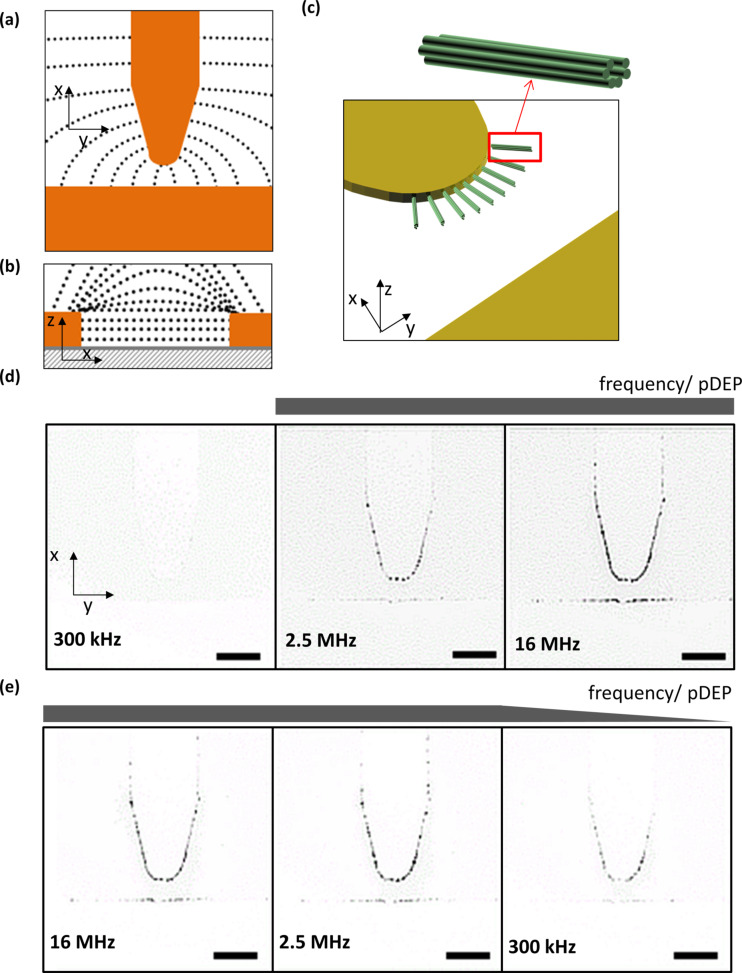
Figure 3.
Dielectrophoretic manipulation of six-helix bundles. Schematic representation of the (a) top and (b) side view of the field line gradient, and (c) the six-helix bundle trapping by positive DEP. Potential is applied along the x-axis. Inverted fluorescence microscopy images of the measurement series taken at 1·106 V/m with a stepwise (d) increasing or (e) decreasing frequency. The scale bar is 25 μm.

