
Figure 3.
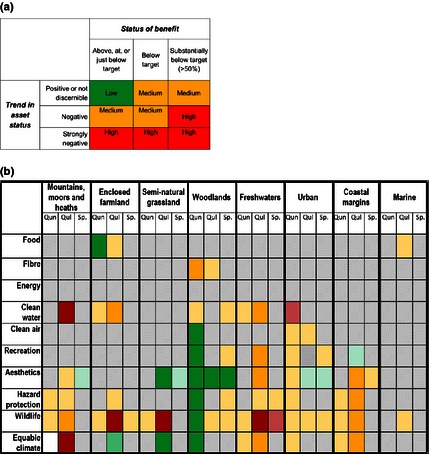
(a) Risk register scoring matrix; (b) The risk register results showing broad habitats as columns, and benefits as rows. The grey cells indicate relationships that were assessed to not be significant or where there is no information from which to make an assessment. Where the relationship is known to the extent that an assessment is possible, the colour of the cell shows the risk rating for the relationship, using the scoring matrix in Fig. 3a. This indicates that the quantity (Qun), quality (Qul) and spatial configuration (Sp.) of the broad habitat type have significant consequence for the benefits; red indicates it is at high risk, orange at medium risk and green at low risk. The density of the colour weakens with more uncertainty (see Table S1 and S2).