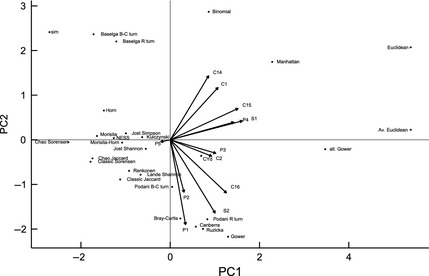
Figure 1.

Biplot of the first two principal components axes of the scores of 29 β‐diversity metrics based on quantitative scores for properties C1–C2, C14–C16, S1–S2 and P1–P5. Four partitioned turnover components are also shown, using the partitioning methods proposed by Baselga (2013) and Podani, Ricotta & Schmera (2013). Together, PC1 and PC2 explain 52% of variation in scores.
