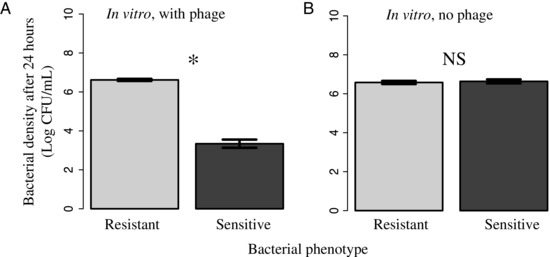
Figure 1.

In vitro bacterial densities of resistant mutants (light grey) versus their sensitive ancestors (dark grey) after 24 hours in the presence (A) or absence (B) of phages. Densities are Log 10 transformed and error bars equal 1 standard error of the mean.
