Figure 1.

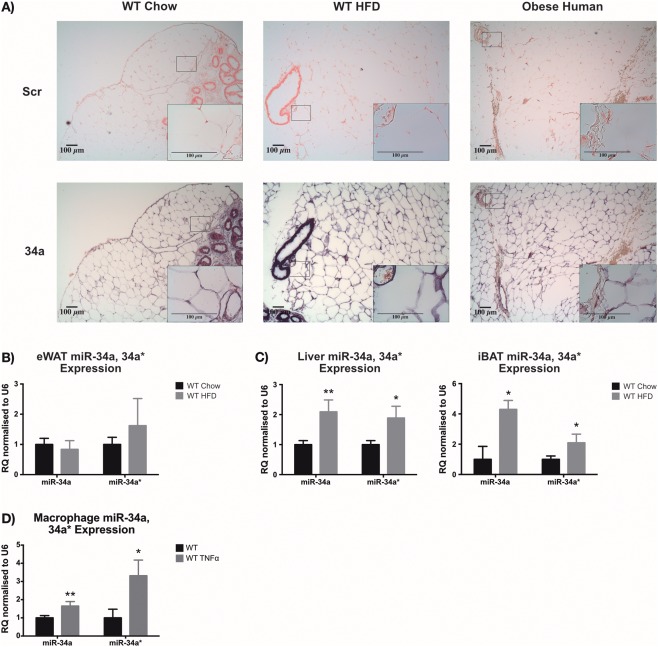
Expression of miR‐34a in adipose tissue. (A) In situ hybridization (ISH) images of miR‐34a expression (purple) compared with a Scramble (Scr; red) negative control in epididymal (e)WAT from WT mice fed chow or high‐fat diet (HFD) for 24 weeks and omental adipose from patients with obesity undergoing bariatric surgery. RT‐qPCR data showing expression of miR‐34a and 34a* in (B) eWAT and (C) liver and intrascapular (i)BAT collected from WT mice 24 weeks after commencing a chow vs. HFD. (D) RT‐qPCR quantification of miR‐34a and 34a* transcripts in WT in vitro bone marrow‐derived macrophages (BMDM) ± 45.45 ng/mL tumor necrosis factor (TNF)‐α for 24 h. Data represented as relative quantification (RQ) with RQmin − RQmax values, normalized to RNU6; n = 3–4 for eWAT, n = 5–6 for liver, n = 6 for iBAT, and n = 3 for BMDMs. *P < 0.05, **P < 0.01, unpaired Student's t‐test.
