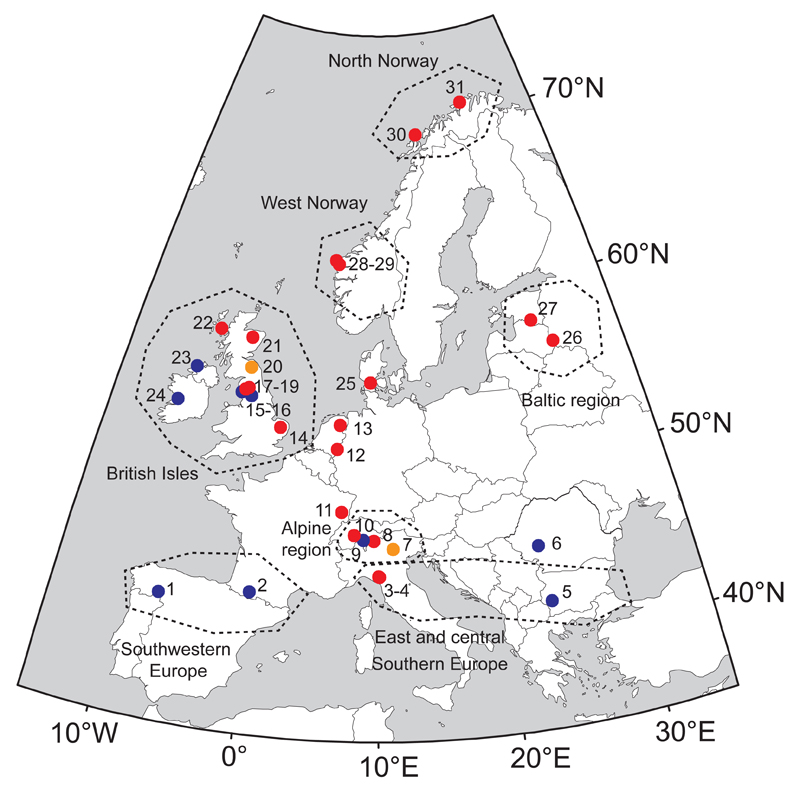
Fig. 1. Location of the chironomid-based temperature records in Europe.
Site numbers are explained in Supplementary Table 1. Records cover the YD/EH transition (red), ELG/BA-IS transition (orange), or both (blue). Dotted lines indicate the regions for which stacked records are provided in Fig. 2.

