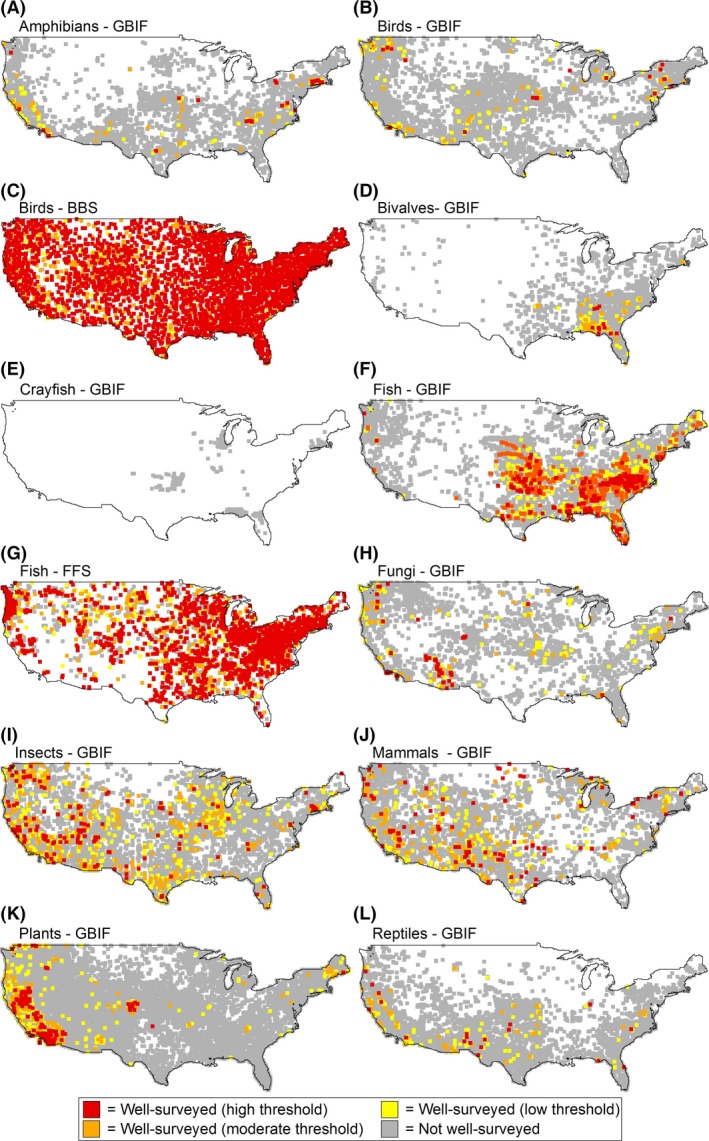
Figure 1.

Distribution of all surveyed grid cells and well‐surveyed grid cells throughout the contiguous United States during the contemporary time period (1990–2013) derived from three open‐access biodiversity databases representing ten taxonomic groups. Note that the square symbols are enlarged (i.e., larger than actual grid cell area) to facilitate visualization of well‐surveyed regions.
