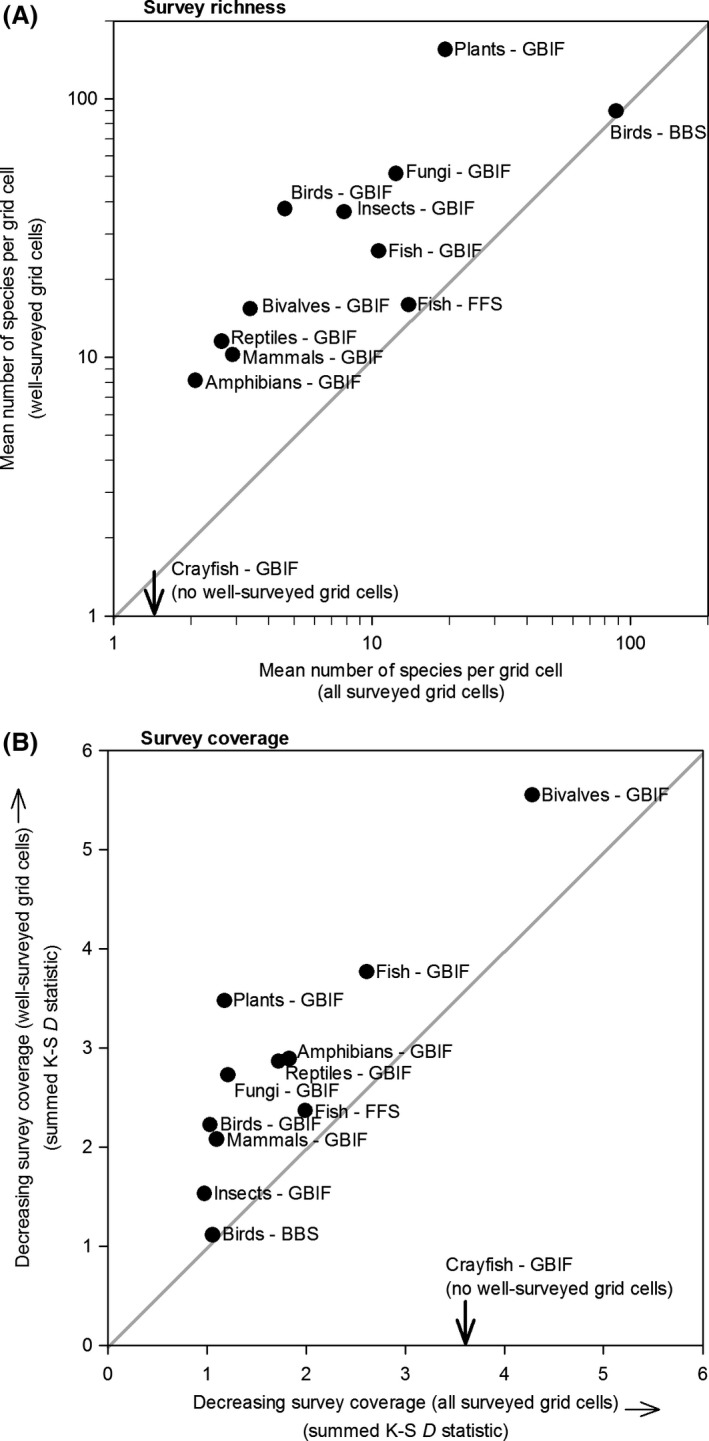
Figure 4.

Relationship between (A) number of species per grid cell and (B) cumulative coverage of well‐surveyed grid cells versus all surveyed grid cells derived from three open‐access biodiversity databases representing ten taxonomic groups. In (B), low values represent unbiased coverage and high values represent biased coverage relative to the background environment. Note that richness and cumulative coverage could not be plotted along the y‐axis for crayfish because no well‐surveyed grid cells were identified.
