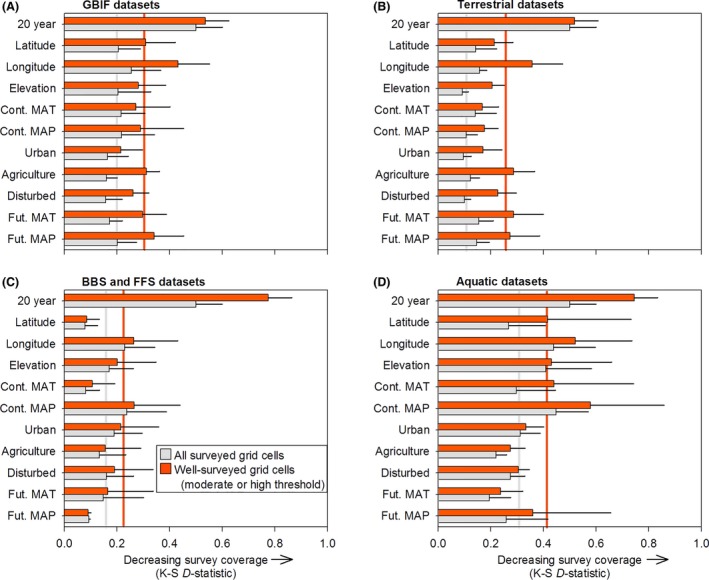
Figure 6.

Coverage indices for each of eleven temporal, spatial, or environmental gradients (twelve taxonomic survey datasets pooled) averaged across (A) GBIF, (B) standardized (i.e., BBS and FFS), (C) terrestrial, and (D) aquatic datasets. Index values are D‐statistics from Kolmogorov–Smirnov goodness‐of‐fit, indicating strong or weak (low or high D‐statistics, respectively) congruence between survey datasets and the background environment. Vertical gray and red lines represent the mean of all eleven datasets for all surveyed grid cells and well‐surveyed grid cells, respectively.
