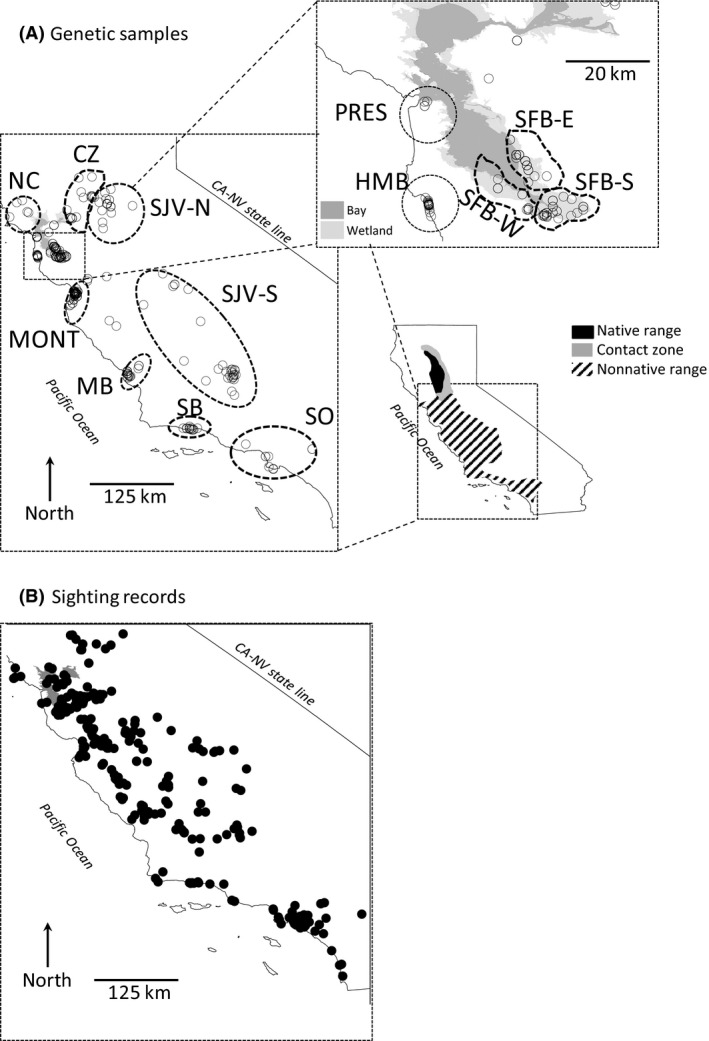
Figure 1.

Distribution of nonnative red fox locations from central and southern California (SO), including (A) 402 genetic samples collected for this study and (B) 349 high‐reliability sighting records independently assembled by Lewis et al. (1993) and used in the present study to construct a landscape resistance model. (A) Inset of California, illustrating ranges of native, nonnative red foxes, and their contact zone (CZ); dashed polygons indicate the following sampling sites: North coastal (NC), native–nonnative contact zone (CZ), San Joaquin Valley (SJV) north (‐N) and south (‐S), Monterey (MONT), Morro Bay (MB), Santa Barbara (SB), SO, and, in the inset (upper right), Presidio of San Francisco (PRES), Half Moon Bay (HMB), and the San Francisco Bay wetlands (SFB) south (‐S), east (‐E), and west (‐W). Miscellaneous samples not associated with the 13 primary sampling sites are also shown.
