
Figure 4.
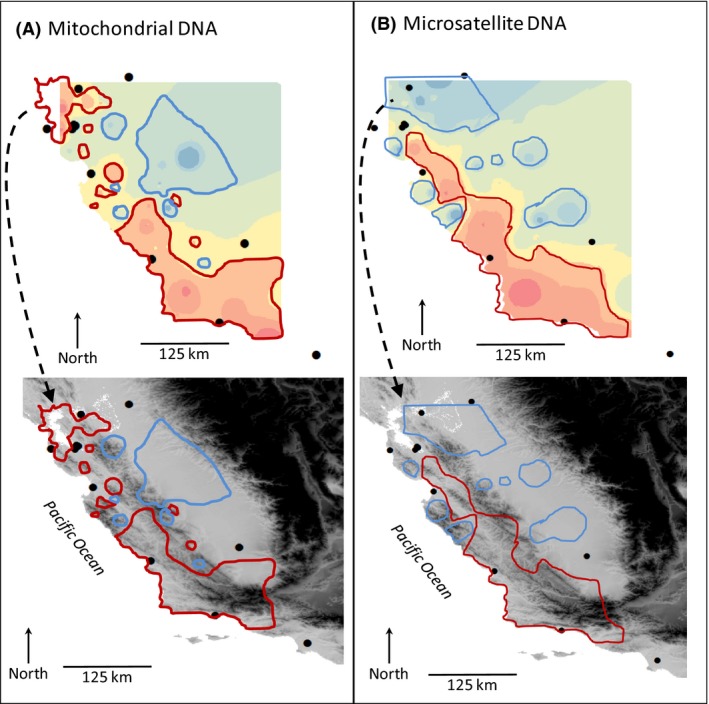
Empirical resistance surfaces inferred from inverse distance‐weighted averaging among pairwise midpoints and their associated Euclidian distance‐adjusted genetic distances (A) F ST/(1 − F ST) for mtDNA and (B) D A for microsatellites. Interpolated surface with illustrative resistance contours highlighted by red lines and connectivity contours highlighted by blue lines are shown on top, with the same contours overlaid on elevation below. Sampling site centroids are shown as filled circles.