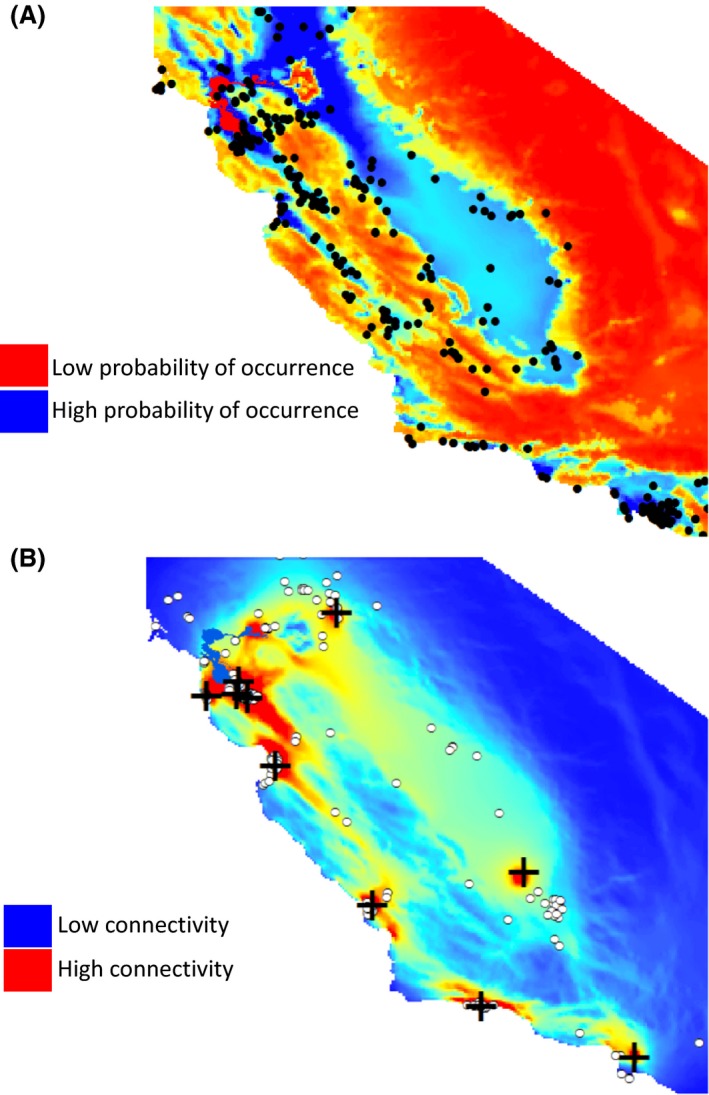
Figure 5.

Landscape models, including (A) a Maxent species distribution model based on locations of 349 sighting reports (filled circles) from Lewis et al. (1993) and (B) connectivity (“current”) map estimated using Circuitscape, along with 402 red fox genetic sample locations (open circles) and 10 corresponding centroids (+) used to test the resistance model.
