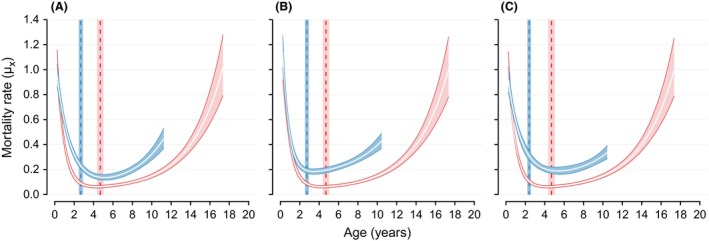
Figure 4.

Age‐specific mortality estimates for male (blue lines and polygons) and female African lions (pink lines and polygons) of the Serengeti population. Polygons represent 95% credible intervals of age‐specific mortality rates with white lines indicating the mean. Mortality rates are plotted until the ages when 95% of a synthetic same‐sex cohort would be dead. The vertical dashed lines indicate mean life expectancy at 0.25 years of age with the 95% confident bands indicated by the rectangles. (A) Model A: all males with uncertain fate and old enough for dispersal treated as potential dispersers. (B) Model B: all males indicated by an expert as potential dispersers treated as known dispersers. (C) Model C: all males indicated by an expert as potential dispersers treated as potential dispersers.
