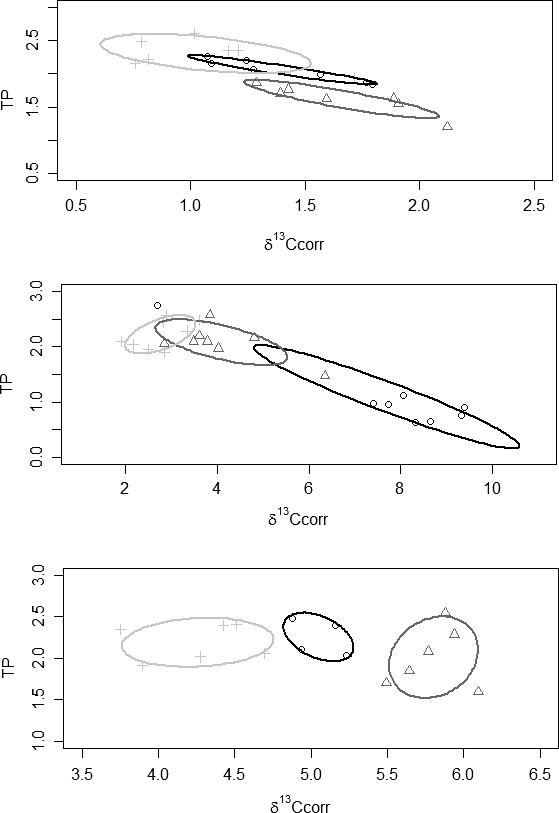
Figure 3.

Stable isotope bi‐plots for the Chub stream where (○) Barbus barbus individuals, (Δ) Squalius cephalus individuals and (+) Leuciscus leuciscus individuals. Solid lines enclose the standard ellipse areas for each species, where black: B. barbus, dark grey: S. cephalus, light grey: L. leuciscus. Note the different scales on the axes. Top: June/August 2014; Middle: June 2015; Bottom: September 2015.
