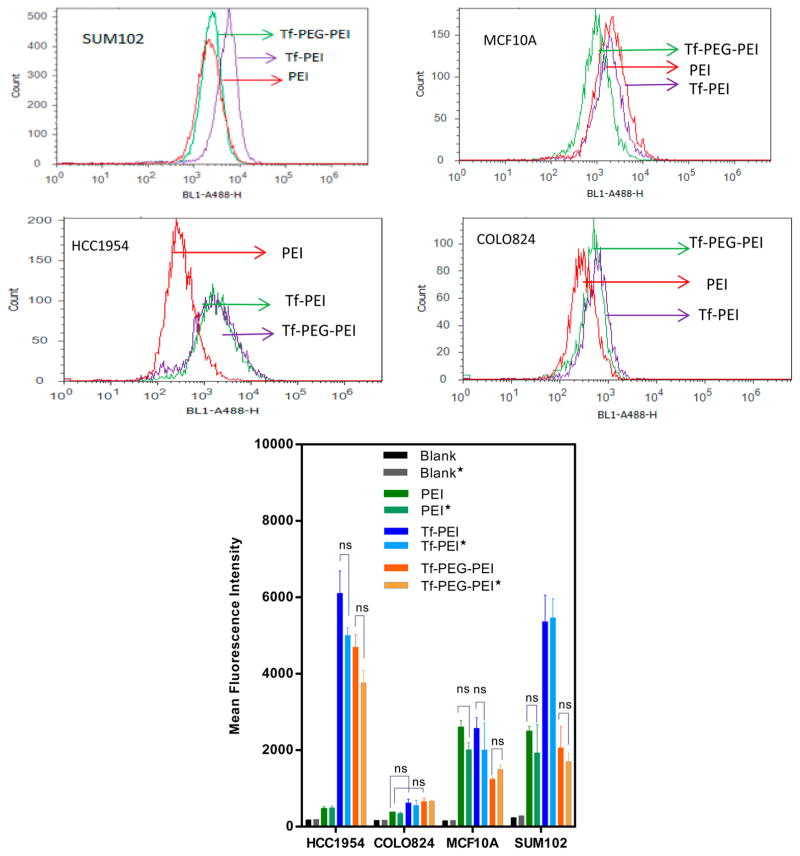
Figure 8.
Comparison of siRNA uptake with different formulations (Blank (untreated cells), PEI (positive control), Tf–PEI, Tf-PEG-PEI) in GACS1 positive (HCC1954 and COLO824) and GASC1 negative (MCF10A and SUM102) cell line models after fluorescence quenching of membrane bound nanoparticles with trypan blue (asterisks indicate cell samples treated with trypan blue). Data are expressed as the mean ± SD (n = 3); ns, nonsignificant.

