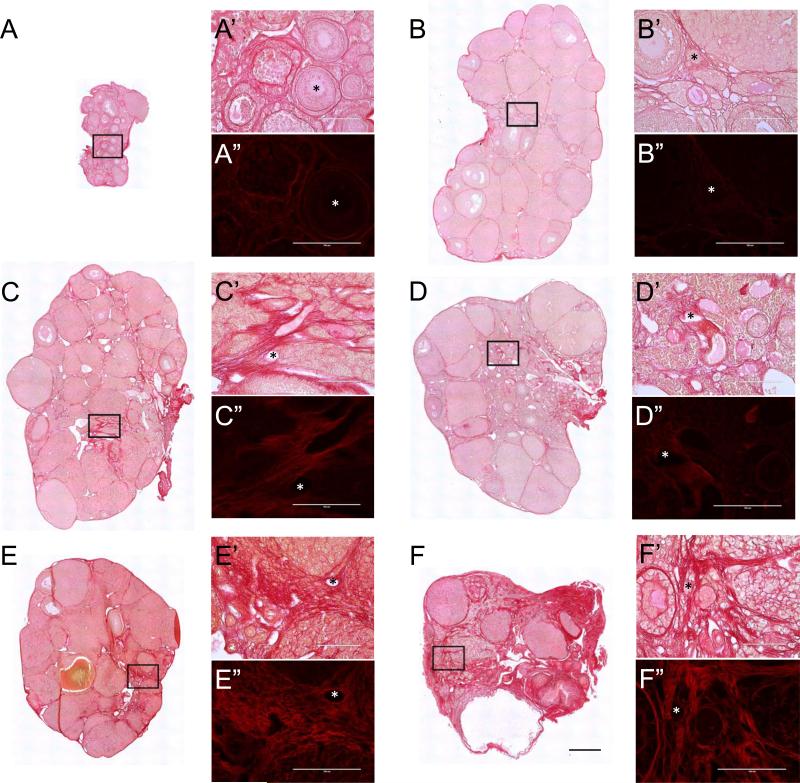
Figure 4. PSR staining expands throughout the ovarian stroma with advanced reproductive age.
Scans of PSR-stained ovarian sections from (A) 6-week old, (B) 5-month old, (C) 7-month old, (D) 9-month old (E) 18-month old, and (F) 22-month old CD1 mice visualized by brightfield microscopy. The scale bar for images in (A-F) is 0.4 mm. (A’-F’ and A”-F”) are higher magnification images from the specific regions of the ovarian stroma that are boxed in (A-F). Brightfield images are shown in (A’-F’) and fluorescence images are shown in (A”-F”). The fluorescence images were taken using a Texas Red LED Light cube with constant settings that were established for the 22-month old sample (F”). Therefore intensity differences across ages can be compared. Asterisks mark corresponding regions between brightfield and fluorescence images. Scale bars in (A’-F’ and A”-F”) are 100 μm.

