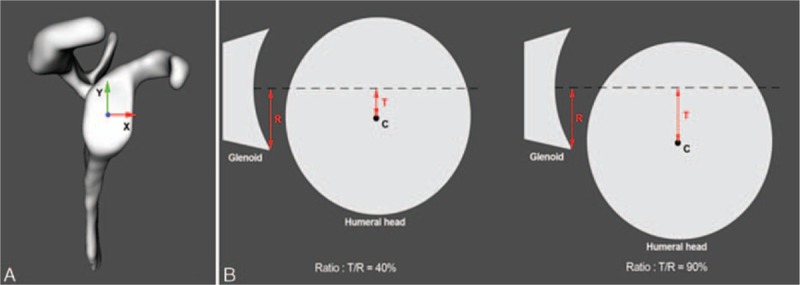
Figure 3.

(A) Definition of the glenoid coordinate system used in this study. (B) Schematic representation of glenohumeral subluxation (C = center of the humeral head, R = radius of the width or height of the glenoid surface, T = translation of the humeral head center). Left: the ratio is 40%, there is no instability. Right: the ratio is >50%, instability is noted. Image reproduced from Lädermann et al[24] with permission.
