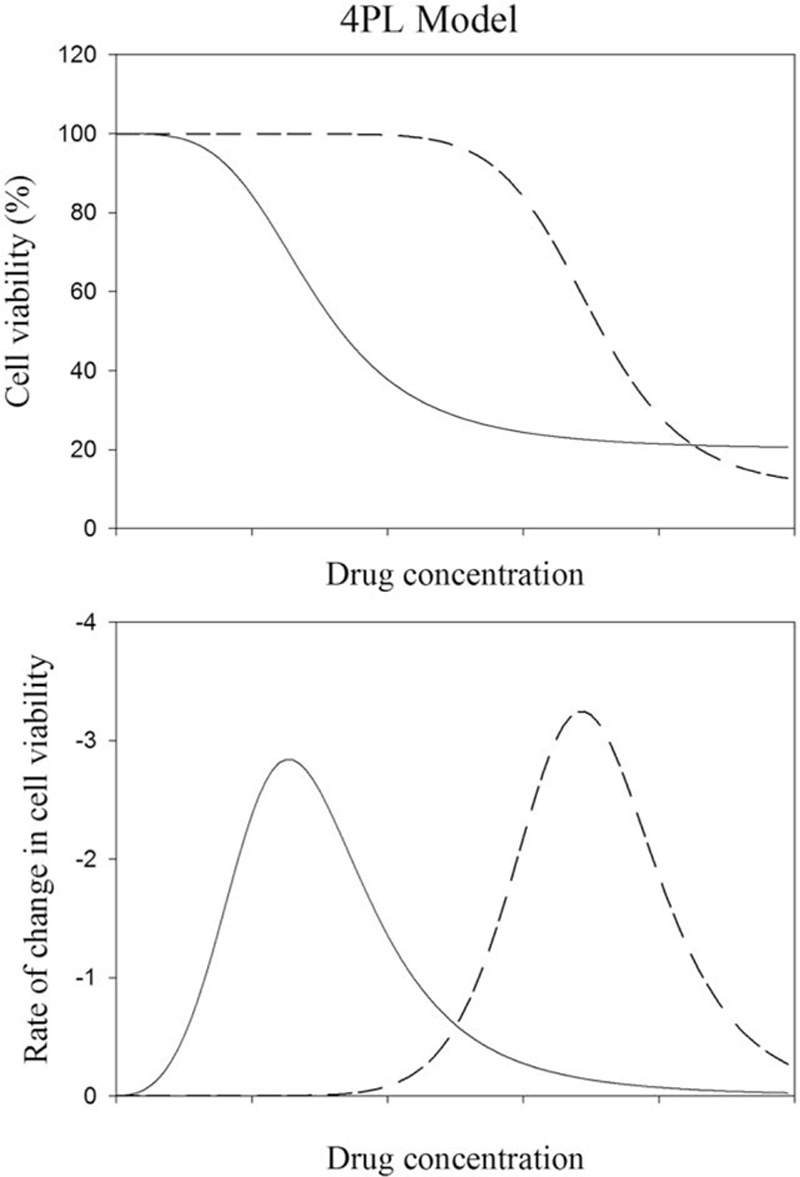
Figure 1.

The curves of cell viability of cancer cells (solid line) and normal cells (dashed line) after the treatment with anticancer drug are shown in the upper panel. The corresponding curves for the rates of change in cell viability of cancer cells (solid line) and normal cells (dashed line) as the functions of drug concentration are shown in the lower panel. A wider separation between the cell viability curves of cancer cells (solid line) and normal cells (dashed line) after drug treatment means that the anticancer drug is safer because it can damage more cancer cells and less normal cells. The resemblance of the curves for the rates of change in cell viability as the functions of drug concentration in the lower panel to the elution peaks as the functions of elution time in HPLC suggests that the safety index (SI) can be defined similar to the resolution index (Rs) in HPLC to quantify the degree of separation between the curves of cell viability of cancer cells and normal cells.
