
Figure 4.
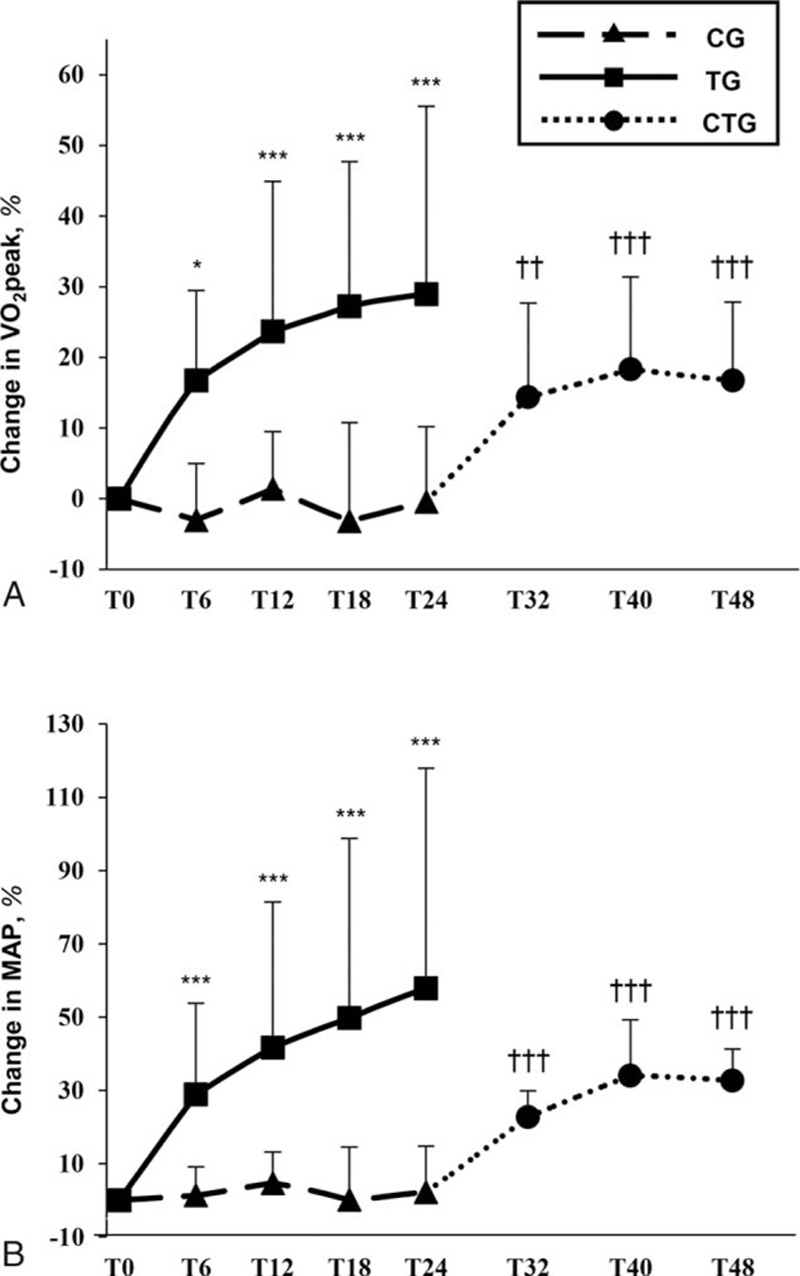
Training effects on cycling parameters. Mean changes in (A) peak oxygen uptake, (B) maximal aerobic power in the training group versus control group in the randomized controlled trial and in the control-training group in the nonrandomized trial. ∗P < 0.05, ∗∗∗P < 0.001, for within-group differences in the randomized controlled trial compared to T0 (2-way repeated measures ANOVA); ††P < 0.01, †††P < 0.001, for differences compared to T24 in the nonrandomized trial (1-way repeated measures ANOVA). CG = control group; CTG = control-training group; MAP = maximal aerobic power; T = time (in weeks from baseline measures, T0); TG = training group; VO2 peak = peak oxygen uptake.