
Figure 5.
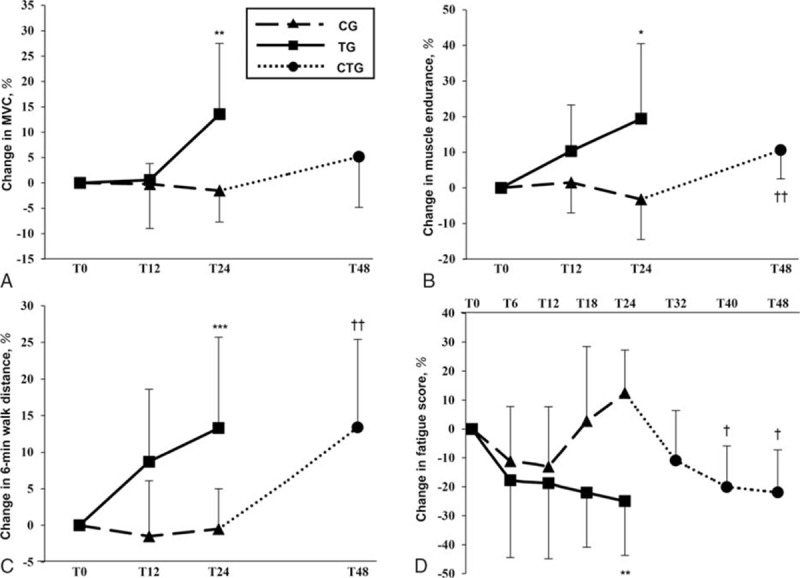
Training effects on neuromuscular, motor, and subjective parameters. Mean changes in (A) isometric maximal voluntary strength, (B) number of submaximal repetitions (muscle endurance), (C) 6-min walking test distance, and (D) experienced fatigue (Fatigue Severity Scale score) in the training group versus control group in the randomized controlled trial and in the control-training group in the nonrandomized trial. ∗P < 0.05, ∗∗P < 0.01, ∗∗∗P < 0.001 for within-group differences in the randomized controlled trial compared to T0 (2-way repeated measures ANOVA); †P < 0.05, ††P < 0.01, for differences compared to T24 in the nonrandomized trial (1-way repeated measures ANOVA). CG = control group; CTG = control-training group; MVC = maximal voluntary contraction; T = time (in weeks from baseline measures, T0); TG = training group.