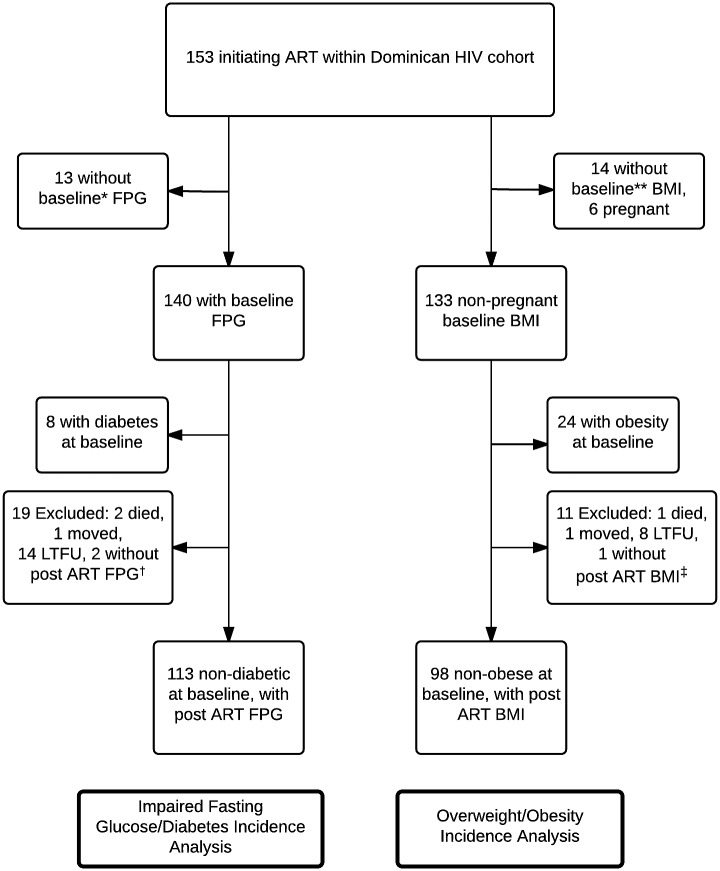
Fig 1. Distribution of cohort patients between impaired fasting glucose/diabetes and overweight/obesity analyses.
ART: antiretroviral therapy; BMI: body mass index; FPG: fasting plasma glucose; LFTU: lost to follow up. *Baseline for DM analysis defined as ≤180 days prior to ART start date. **Baseline for obesity analysis defined as BMI measured ≤180 days prior to ART start date or up to 30 days after ART start. †Post ART FPG measured ≥2 weeks after ART initiation. ‡Post ART BMI measured ≥180 days after ART initiation.

