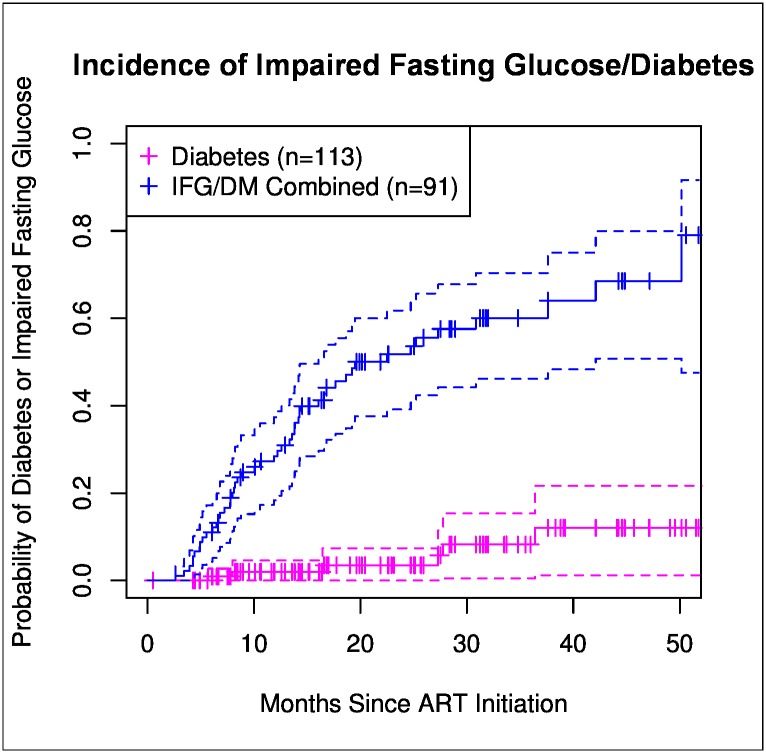
Fig 2. Kaplan-Meier curves representing risk of developing impaired fasting glucose /diabetes.
Pink line represents the risk of developing diabetes (DM) and blue line represents risk of the combined endpoint of impaired fasting glucose (IFG)/DM, from normoglycemic baseline as a function of the number of months of ART. DM defined as ≥1 fasting plasma glucose (FPG) ≥126, documented use of hypoglycemic medication, or DM diagnosis per the medical record. IFG defined as ≥1 FPG ≥ 100 mg/dl and no FPG ≥126 mg/dl. Vertical tick-marks indicate patients whose survival times have been right-censored. Dashed lines represent 95% confidence intervals.

