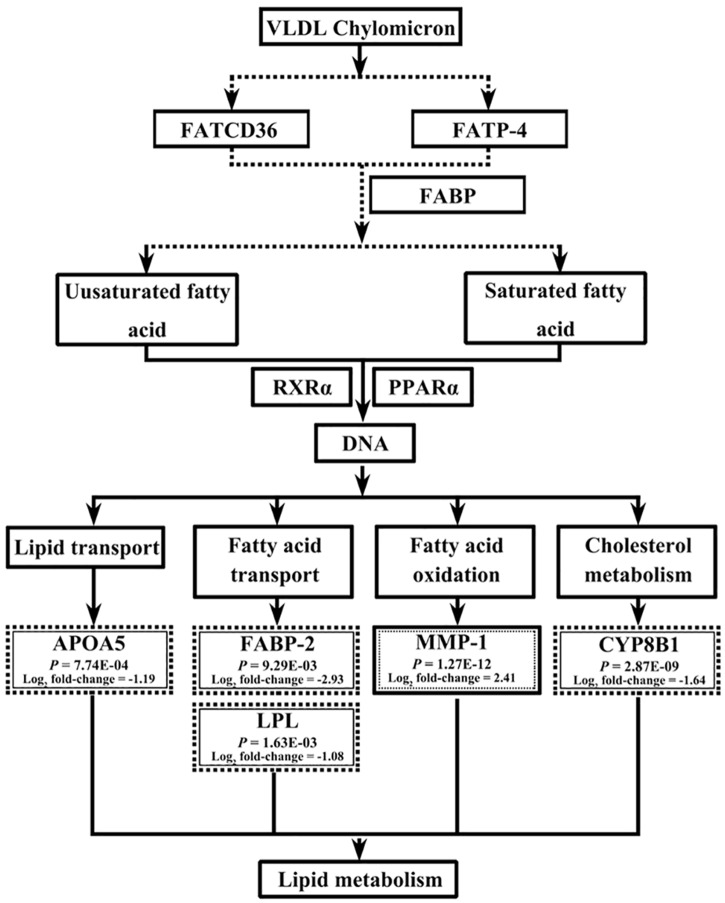
Fig 2. Influence of butyrate glycerides on the genes downstream the PPAR signaling pathway in the liver of broilers.
The genes in the text box with dotted outer line and full inner line are down-regulated, while those in the text box with full outer line and dotted inner line are up-regulated compared to the control group. All genes showing a significant difference in expression had the cut-offs of P-value ≤ 0.05 and absolute value of Log2 fold change ≥ 1. This figure was generated based on the results of DAVID-BR analysis.

