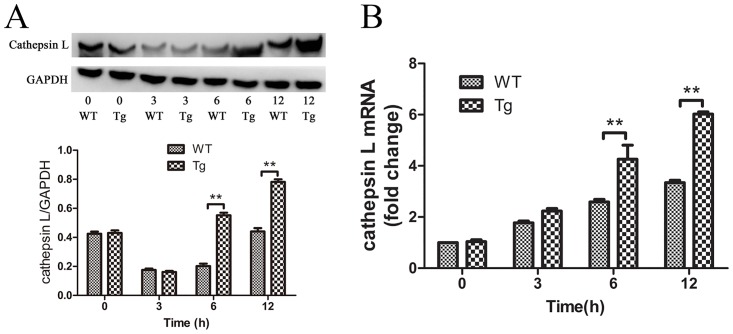
Fig 7. Cathepsin L expression in the heart from WT and Tg mice.
(A) The expression of cathepsin L protein was detected with western blot. Relative protein levels were quantified and normalized to GADPH (n = 3). (B) The expression of cathepsin L at transcriptional level was examined by real-time PCR (n = 3). Figures are representative of three independent experiments. Values were presented as mean ± SEM, *p< 0.05, **p< 0.01, one-way analysis of variance (ANOVA) and Bonferroni’s multiple comparison tests.

