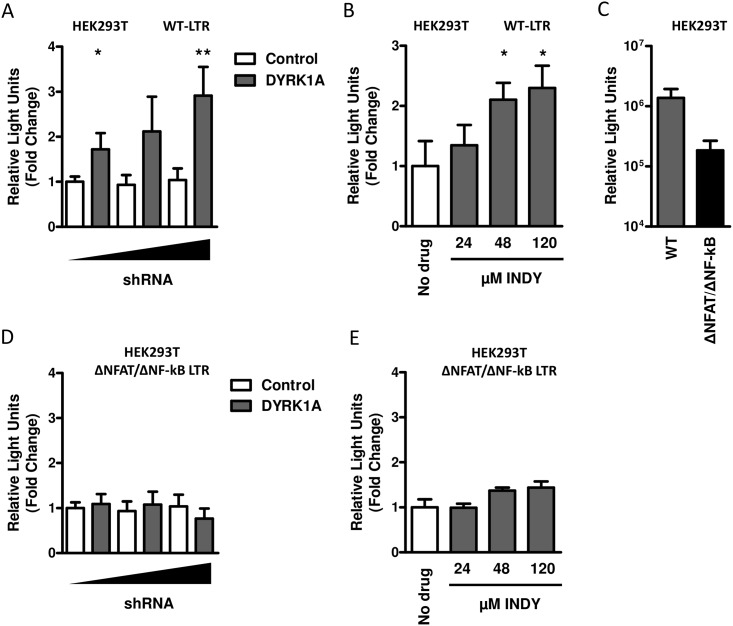
Fig 2. The effect of DYRK1A knockdown or inhibition on LTR driven transcription.
(A) The effect of DYRK1A downregulation on LTR driven transcription was analyzed by co-transfection of HEK293T cells in 96-wells plates with 5 ng of LTR-luciferase reporter construct and 12.5 ng, 25 ng or 50 ng of shDYRK1A or the shControl vector. Luciferase activity was analyzed 48-hours post-transfection as a measure for LTR activity and expressed relative to the shControl. (B) The effect of DYRK1A inhibition on LTR driven transcription was analyzed by transfecting HEK293T cells in 96-wells plates with 5 ng of LTR-luciferase reporter construct. Twenty-four hours post transfection cells were treated with 24 μM, 48 μM or 120 μM of either INDY or the DMSO control and after an additional 24-hours luciferase activity was determined and expressed relative to DMSO control (No Drug). (C) Comparison of basal transcriptional levels of the LTR-luciferase reporter construct and LTR-luciferase reporter construct lacking the NFAT and NF-kB binding sites was performed by transfecting HEK293T cells in 96-wells plates with 5 ng of either construct. Luciferase activity was analyzed 48-hours post-transfection as a measure for LTR activity. The effect of DYRK1A downregulation (D) or inhibition (E) on LTR driven transcription was analyzed by co-transfection of HEK293T cells in 96-wells plates with 5 ng of LTR-luciferase reporter construct lacking the NFAT and NF-kB binding sites and 12.5 ng, 25 ng or 50 ng of shDYRK1A or the shControl vector or treatment with 24 μM, 48 μM or 120 μM INDY. Luciferase activity was analyzed 48-hours post-transfection as a measure for LTR activity and expressed relative to the shControl. Significance was determined with an unpaired student’s T test. *p<0.05, **p<0.01. Data is shown as mean and SD of three independent experiments.

