Fig. 2.

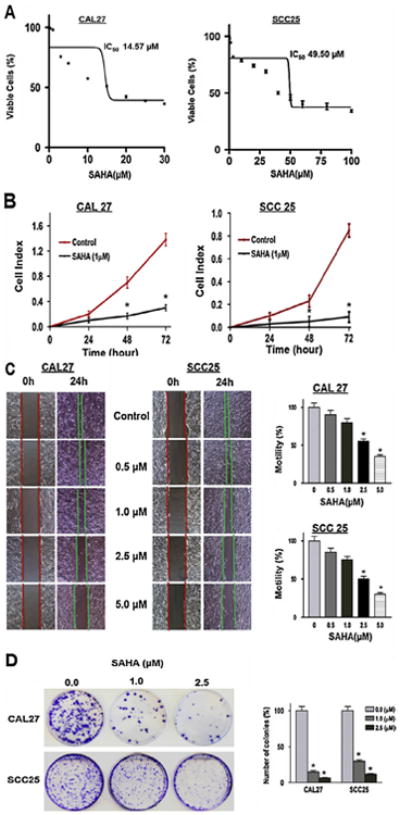
SAHA treatment reduced tumorigenic properties of CAL27 and SCC25 cells in vitro. (A) Determination of IC50. Cells were treated with varying concentrations of SAHA (0–100 μM), and the percentage of viable cells was quantitated after 24 h by CellTiterGlo assay. Representative data from three experimental replicates are shown. Data is presented as mean ± SD. (B) Cell proliferation. Cell proliferation assay was performed using equal number of cells on xCELLigence assay while cells were either treated with DMSO or SAHA (1 μM). Each assay was performed in quadruplicate and repeated twice. Data showing 94% and 97% decrease in cell proliferation upon SAHA treatment in CAL 27 and SCC25, respectively. Data is presented as mean ± SD, (*p-value ≤ 0.05). (C) Cell migration. Cell migration/motility assay was performed using equal number of cells on six well plates while cells were either treated with DMSO or SAHA at the indicated doses (for details see Methods section). Cell motility assay shows the reduction in cell motility from the edges of the wounded cell into the central area in presence of different concentrations of SAHA in CAL27 and SCC25 cell lines. Columns of the bar graphs are representing the area covered by the cells in 24 h time point (magnification 40×). Each assay was performed in triplicate and repeated twice. Data is presented as mean ± SD, (*p-value ≤ 0.05). (D) Colony formation. Clonogenic survival assay was performed using equal number of cells with cells pre-treated with DMSO or SAHA at the indicated doses (for details see Methods section). Colonies were stained with crystal violet and counted. Clonogenic survival assay of different concentration of SAHA treated CAL27 and SCC25 (top). Graphical representation of the colonies formed in control and treated cell lines (bottom). A significant decrease in colony formation is observed in these cell lines (magnification 40×). Each assay was performed in triplicate and repeated twice. Data is presented as mean ± SD, (*p-value ≤ 0.05).
