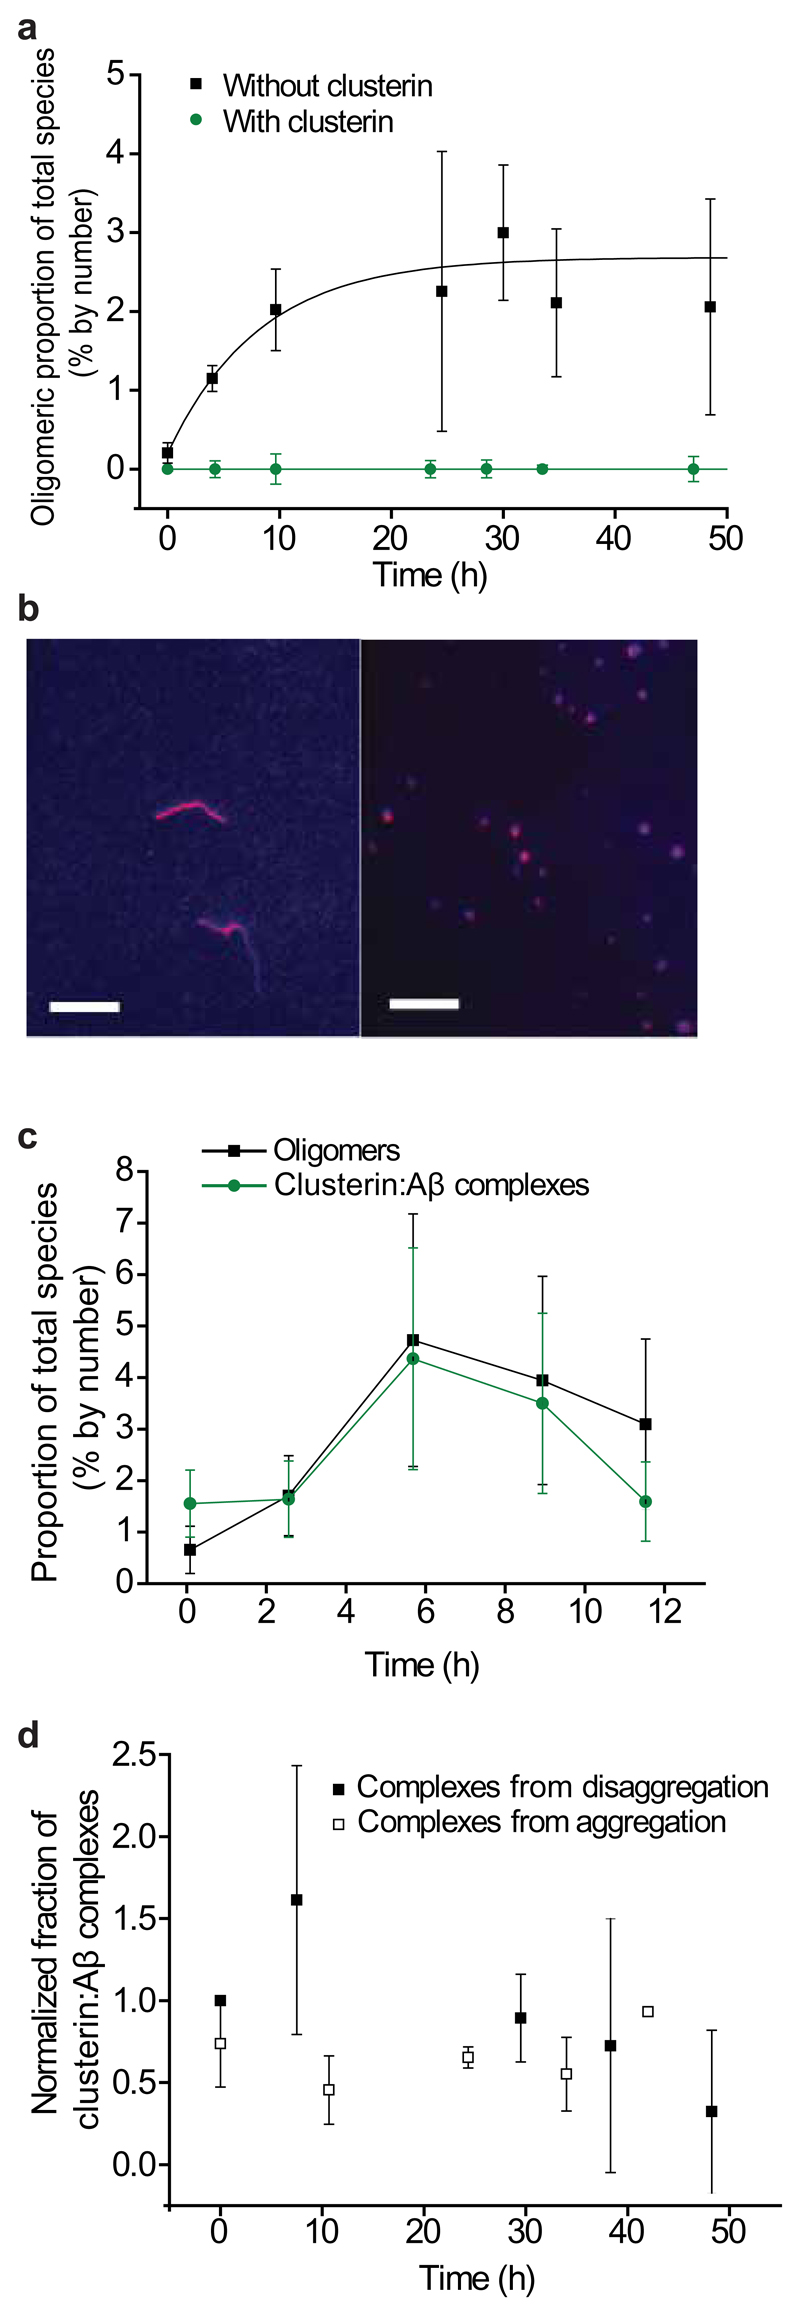
Figure 2.
The effects of clusterin on the aggregation of Aβ1–40. (a) Fraction of oligomers detected in solution during the aggregation of Aβ1–40 with and without clusterin (Aβ1–40 and clusterin are both at a concentration of 600 nM, n=3, error bars are s.e.m.). (b) TIRFM image of the species present after 24 h of aggregation of a 2 μM solution of Aβ1–40 without clusterin (left). TIRFM image of a 2 μM solution of Aβ1–40 after 24 h of aggregation but with 2 µM clusterin added 4 h after the start of the reaction, during the fibril growth phase (right). An approximately 50% reduction in the average size of species present is observed in the presence of clusterin (from 1400 ± 200 nm without clusterin to 780 ± 60 nm with clusterin, s.e.m., P-value is 0.01, two-sample independent, two-tailed, t-test). Scale bars are 5 µm. (c) Fractions of species formed during the aggregation of a 2 μM solution that are oligomeric and that are in Aβ:clusterin complexes. (n=3, error bars are s.e.m.). (d) Proportion of Aβ:clusterin complexes persisting at 10–20 nM (total peptide concentration) at 21 °C. Complexes were formed between clusterin and oligomers from both aggregation and disaggregation reactions. For both traces, n=3, error bars are s.e.m. There is no statistically significant change in the proportion of complexes with oligomers formed during either the disaggregation experiment (P-value of 0.77, ANOVA single-factor) or the aggregation experiment (P-value of 0.99, ANOVA single-factor).

