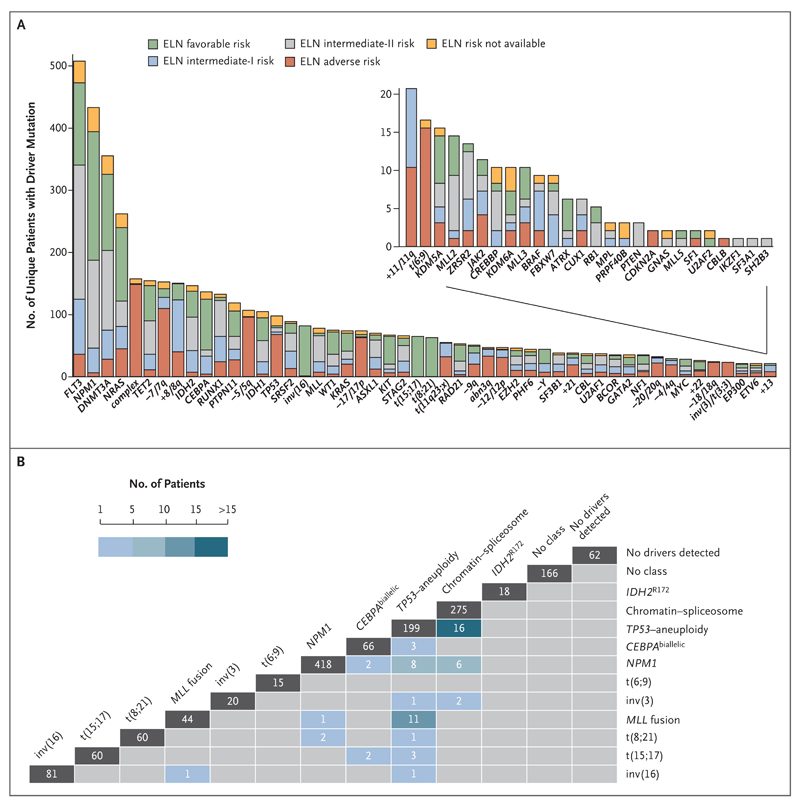
Figure 1. Landscape of Driver Mutations in Acute Myeloid Leukemia (AML).
Panel A shows driver events in 1540 patients with AML. Each bar represents a distinct driver lesion; the lesions include gene mutations, chromosomal aneuploidies, fusion genes, and complex karyotypes. The colors in each bar indicate the molecular risk according to the European LeukemiaNet (ELN) classification. Panel B shows the distribution of samples and overlap (cross-sections) across molecular subgroups (vertical bars). Patients who had no driver mutations and those who had driver mutations but did not meet the criteria for any specific class are also included. The number at the top of each column is the number of patients assigned solely to the designated class; the numbers of patients meeting criteria for two or more classes are shown at the intersection of classes.

