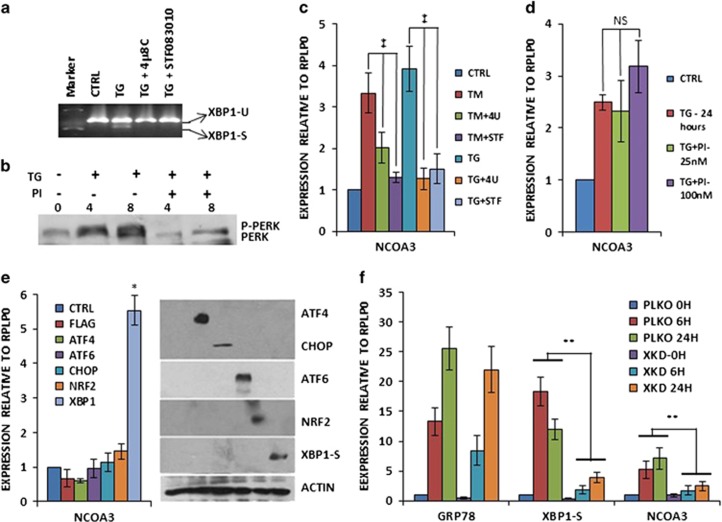
Figure 2.
Upregulation of NCOA3 during UPR is mediated by the IRE1–XBP1 pathway. (a) MCF7 cells were either untreated (CTRL) or treated with (1.0 μm) TG in the absence and presence of IRE1 inhibitors, (10 μm) 4μ8C (4 U) and (100 μm) STF083010 (STF) for 24 h. Cells were harvested and expression of XBP1 (unspliced and spliced) was analysed by RT–PCR followed by gel electrophoresis. (b) MCF7 cells were treated with TG (1.0 μm) in the absence and presence of (25 nm) GSK-PERK inhibitor (PI) for indicated time points. Whole-cell lysates were subjected to sodium dodecyl sulphate–polyacrylamide gel electrophoresis (SDS–PAGE) followed by immunoblotting using PERK antibody. (c) MCF7 cells were either untreated (CTRL) or treated with TG (1.0 μm) and (1.0 μg/ml) TM in the absence and presence of IRE1 inhibitors as in (a), and the expression level of NCOA3 was quantified by real-time RT–PCR, normalizing against RPLP0. Error bars represent mean±s.d. from three independent experiments performed in triplicate. (d) MCF7 cells were either untreated (CTRL) or treated with (1.0 μm) TG in the absence and presence of (25 nm) GSK-PERK inhibitor (PI) for 24 h. The expression level of NCOA3 was quantified by real-time RT–PCR, normalizing against RPLP0. Error bars represent mean±s.d. from three independent experiments performed in triplicate. (e) MCF7 cells were transfected with (CTRL) pcDNA3-FLAG or plasmids expressing indicated UPR transcription factors (ATF4, ATF6, CHOP, NRF2 and XBP1-S). Cells were harvested 24 h post transfection normalizing against RPLP0. Error bars represent mean±s.d. from three independent experiments performed in triplicate. Equivalent amounts of cell lysates were resolved by SDS–PAGE and immunoblotting was performed using antibodies against FLAG, ATF6, spliced XBP1 and β-actin. ATF4, CHOP and NRF2 are FLAG-tagged. β-Actin served as a loading control. (f) MCF7-control (PKLO) and MCF7-XBP1 knockdown (XKD) cells were treated with (1.0 μm) TG for indicated time points. The expression levels of GRP78, XBP1-S and NCOA3 was quantified by real-time RT–PCR, normalizing against RPLP0. Error bars represent mean±s.d. from three independent experiments performed in triplicate. *P<0.05, two-tailed unpaired t-test compared with untreated cells; ‡P<0.05 for one-way ANOVA; **P<0.05, two-tailed unpaired t-test comparing respective time points; NS, not significant at P<0.05.

