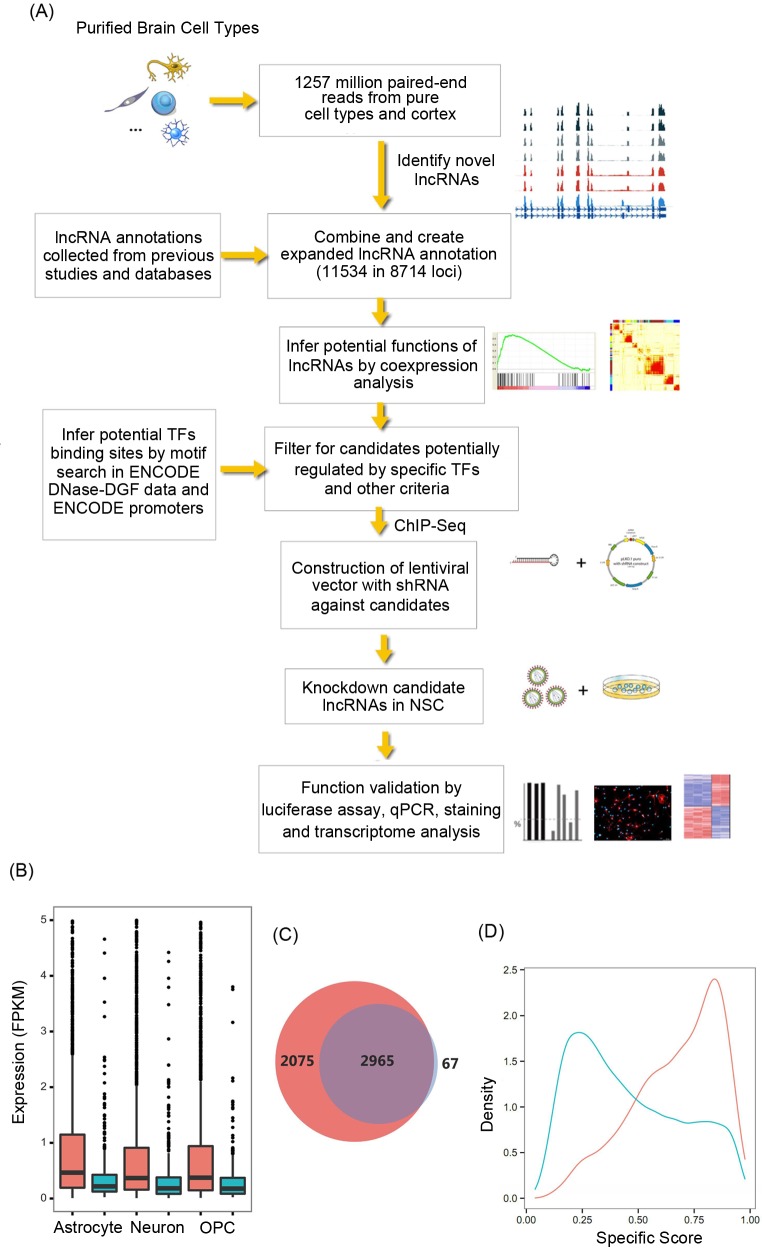
Fig 1. Overview of study diagram and evaluation of lncRNA expression.
(A) Schematic of the data integration and experiment validation. (B) Box plots illustrate expression level distributions of lncRNAs detected in Astrocytes, Neurons, and OPC cells (Red: lncRNAs that are also detected in cortex tissue samples; Blue: lncRNAs that are not detected in cortex tissue samples. Any lncRNAs with expression level of FPKM > 5 were excluded to allow the plot to be presented at a suitable scale. (C) Venn diagram shows lncRNAs detected in purified cell samples (red) or tissue samples (blue). (D) Cell-type specificity of the expression patterns of lncRNAs. Shown are the distributions (represented as a density curve) of specificity scores calculated for each gene across cell types, for coding genes (blue) and lncRNAs (red). The specificity score was calculated with a previously proposed index, which varies from 0 for housekeeping genes to 1 for cell-type specific genes.

