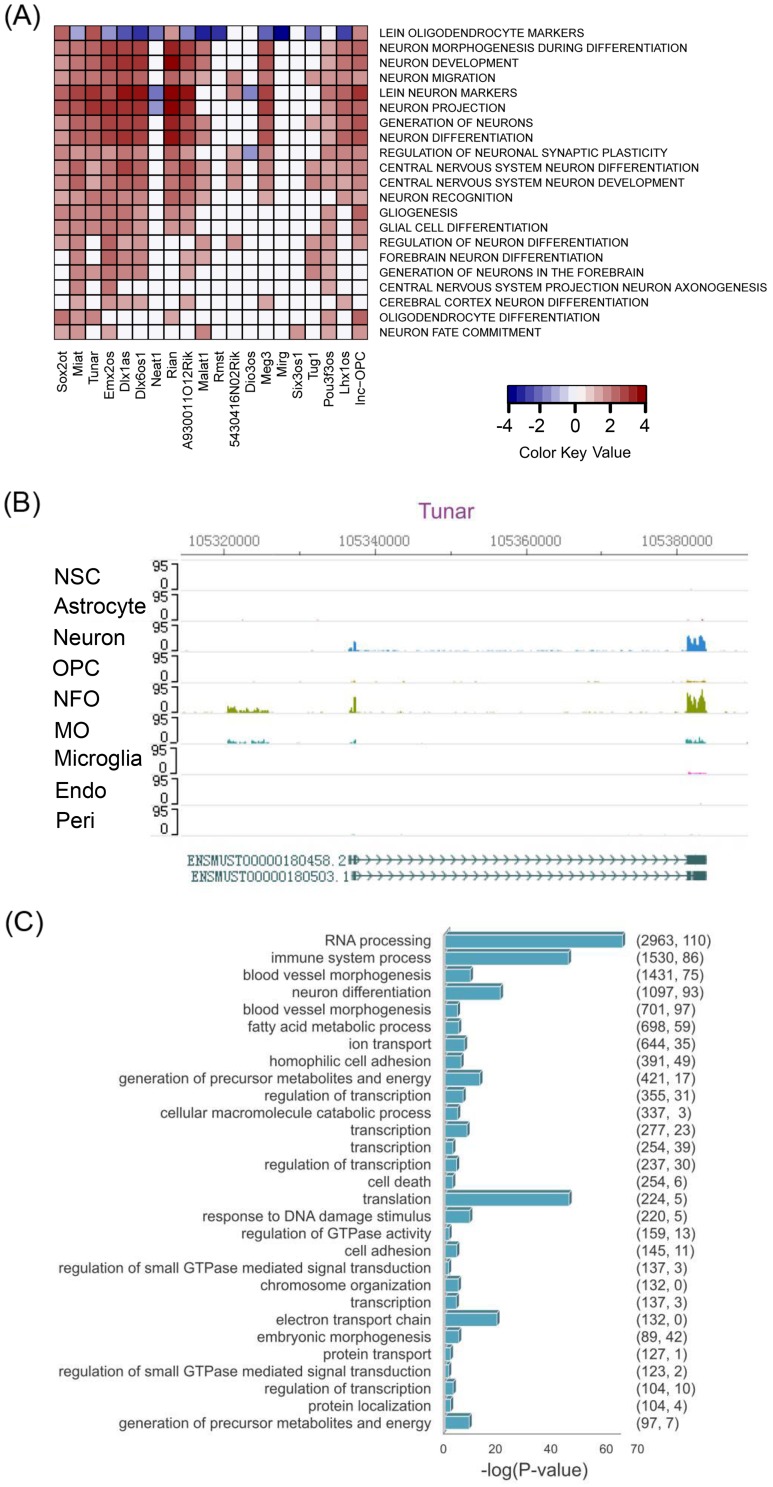
Fig 2. Predicting putative functions of lncRNAs.
(A) Shown is a heatmap representing an association matrix of lncRNAs and functional terms. Columns represent lnc-OPC and lncRNAs that are known to be expressed in brain and have known functions in the literature. Rows represent selected gene ontology terms and MsigDB gene sets. Color depth represents NES (normalized enrichment score) calculated by GSEA, indicating the strength of association. (B) RNA-Seq signal tracks for lncRNA Tunar across cell types are shown. All tracks are set to the same scale for easy comparison of expression levels. (C) GO enrichment analysis of co-expression modules identified by WGCNA. Only the most significant GO Biological Process terms are displayed for modules with > 100 members.

