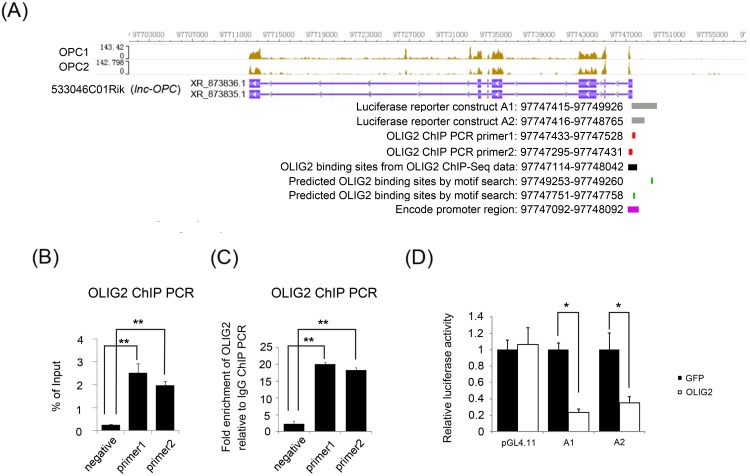
Fig 5. OLIG2 binds to upstream regulatory region of lnc-OPC and controls its expression.
(A) Read mapping signal tracks of lnc-OPC. The upstream regulatory regions of lnc-OPC cloned into luciferase reporter constructs are indicated by grey bars. OLIG2 ChIP-qPCR targeted regions are indicated by red bars. OLIG2-binding sites revealed by OLIG2 ChIP-Seq are indicated by black bars. OLIG2-binding sites predicted by motif search are indicated by green bars. The ENCODE-annotated promoter region is indicated by a purple bar. (B, C) Detection of OLIG2-binding sites in the upstream regulatory region of lnc-OPC by OLIG2 ChIP-qPCR. Two pairs of primers were used. Enrichment over genomic input DNA and fold changes over IgG control were calculated. Experiments were performed in triplicate and error bars indicate Standard Error. t-test analysis ** p< 0.01. (D) The effect of OLIG2 on luciferase expression is represented as changes in relative luciferase activity. The 293FT cells were cotransfected with the luciferase reporter plasmids containing different lengths of the lnc-OPC regulatory region, along with an OLIG2- or GFP-expressing construct. Empty pGL4.11 vector was used as a control. The luciferase activity of cells cotransfected with GFP and luciferase reporter plasmids were used as controls and set to 1. Luciferase activity for each sample was normalized to GFP-transfected controls. Experiments were performed in triplicate and error bars indicate Standard Error. t-test analysis * p< 0.05.

