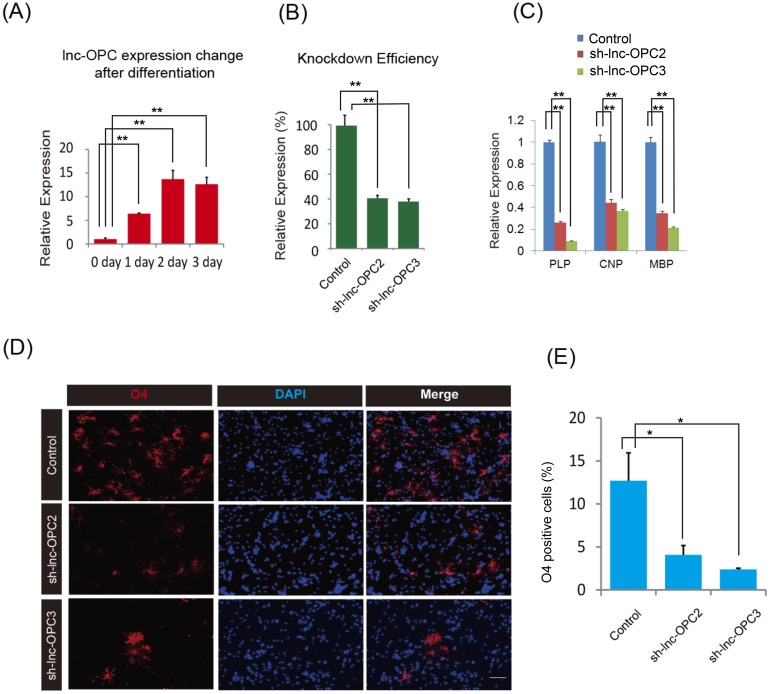
Fig 6. Loss-of-function experimental validation of lnc-OPC function in OPC formation.
(A) Changes in lnc-OPC expression upon differentiation of OPCs from NSCs. lnc-OPC expression in NSCs without differentiation was set to 1. The expression of lnc-OPC increased upon differentiation of OPCs from NSCs. (B) Efficiency of knockdown of lnc-OPC expression by shRNAs in puromycin-selected NSCs, as evaluated by qPCR. Two shRNAs, sh-lnc-OPC2 and sh-lnc-OPC3, succeeded in knocking down lnc-OPC expression when compared to control (sh-Luc). lnc-OPC expression in control was set to 100%. (C) Expression of OPC markers in control (sh-Luc) and lnc-OPC-depleted cultures (two constructs were used: sh-lnc-OPC2 and sh-lnc-OPC3) upon differentiation of OPCs from NSCs. The expression of OPC markers in controls were set to 1. Knockdown of lnc-OPC reduced the expression of PLP, CNP, and MBP. For A-C, experiments were performed in triplicate and error bars indicate Standard Error. t-test analysis ** p< 0.01. (D) Immunostaining analysis of OPC formation in control (sh-Luc) and lnc-OPC-depleted cultures (two constructs were used: sh-lnc-OPC2 and sh-lnc-OPC3). Images were taken after differentiation for 5 days. Blue: DAPI, Red: O4. Scale bar, 100 μm. (E) Quantification of OPC differentiation from puromycin-selected NSCs was measured as the percentage of O4+ cells. Results are from three independent experiments and 10 randomly selected microscopy fields were counted each time. t-test analysis * p< 0.05.

