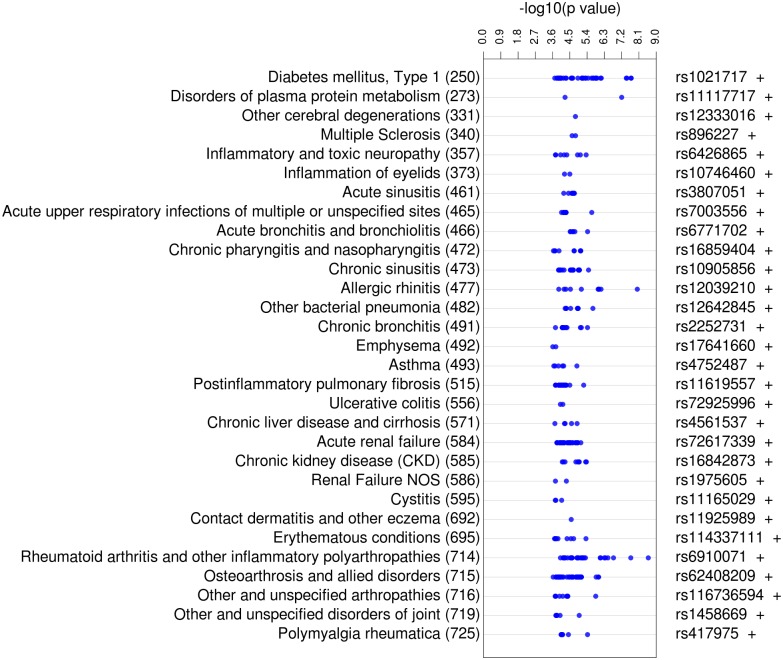
Fig 3. PheWAS View Plot of Meta-analysis Results with p<0.01 Replicating for the Same ICD-9 Category, Meeting Autoimmune and Immune-Related Diagnosis Criteria.
The left track specifies the phenotype and ICD-9 Category code with which the SNP was associated. The next track indicates–log10(p-value) from the meta-analysis performed on all replicating SNPs with p<0.01. The last track indicates the SNP that had the most significant p-value, and the direction of effect of the association (+, positive; -, negative). The total number of associations between the SNPs and diagnoses was 409.

