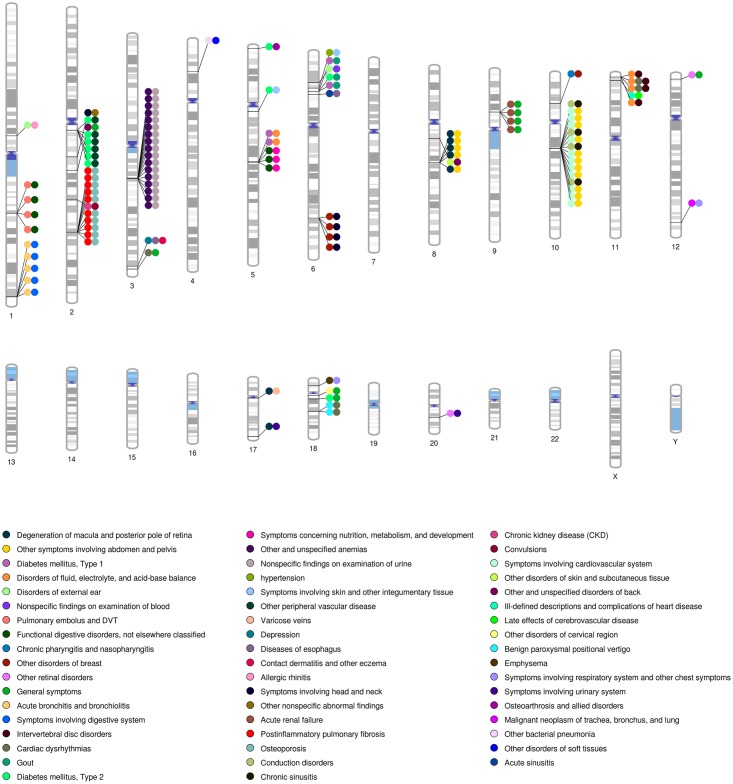
Fig 4. Pleiotropy: SNPs Associated with more than One Phenotype and Replicating across more than One Study for the Same ICD-9 Category.
This chromosomal ideogram has lines indicating the location of the SNP, with filled colored circles indicating different ICD-9 code diagnoses associated with that particular SNP. When there are multiple pairs of the same phenotypes in the same region, this indicates regions where several SNPs in close proximity were associated with the same pairs of phenotypes.

