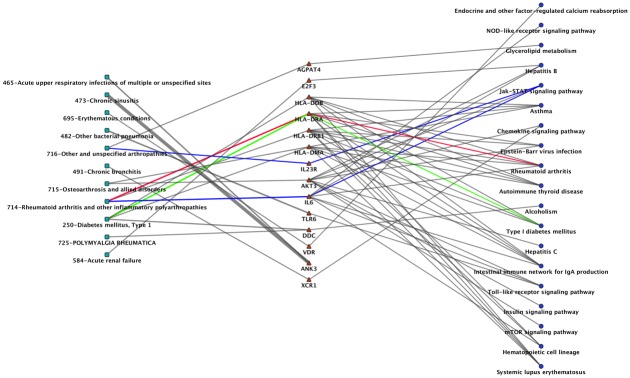
Fig 5. Cytoscape Network Showing the Connections between Phenotypes, the Genes with SNPs, and Pathways.
In this network, green squares represent phenotype; red triangles represent genes; and blue circles are KEGG pathways. The colored lines highlight the link between phenotype and pathway. For the gene HLA-DRA with SNPs associated with “714: rheumatoid arthritis” and “250: type 1 diabetes” is present in the KEGG pathway of “rheumatoid arthritis” (red line) and “type 1 diabetes” (green line) respectively. Also, the blue edge shows the connection between “714: rheumatoid arthritis”, “716: other specified arthropathies” and the KEGG “JAK-STAT signaling pathway” through two interleukin genes, IL23R and IL6.

