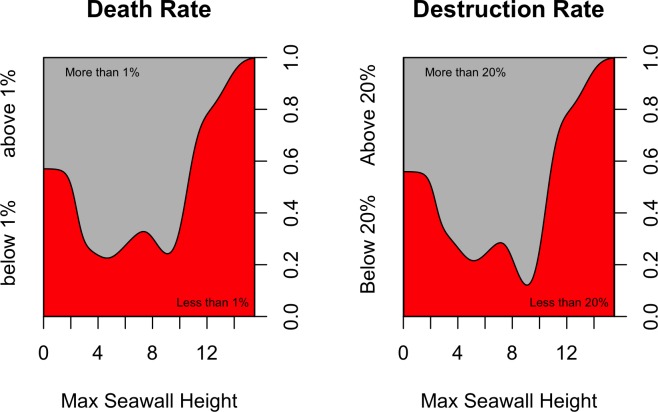
Fig 7. Conditional density plots for death and damage rates versus maximum seawall heights.
Here the response variables are binary, representing whether death and damage rates are above or below their median values. For a given seawall height, a greater proportion of red means lower death or damage rates, while a greater proportion of gray means higher death or damage rates.

