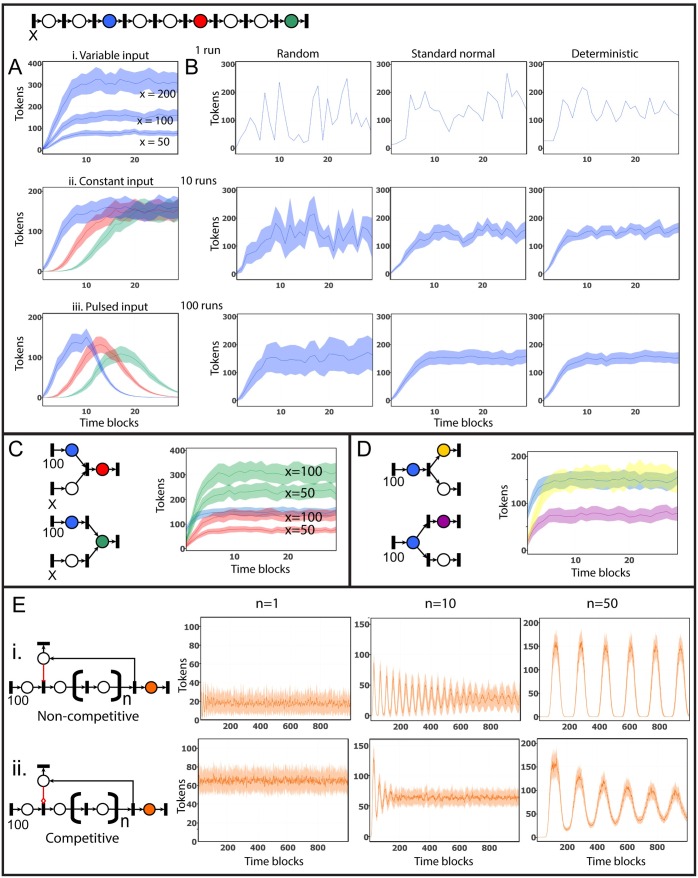
Fig 4. Flow simulation through simple pathway motifs.
(A) A linear network with tokens added to the system on the first node (X) illustrates how differences in the placement of tokens and SPN parameters affect token output flow. Token accumulation on the blue, red, and green nodes in the network has been used to illustrate the effect changing the number and/or pattern of tokens introduced. (i) Varying the initial token input (X = 50, 100, or 200), (ii) the rate of token accumulation at different points downstream of a constant input (X = 100), and (iii) token flow following a pulsed input of tokens (100 tokens during time blocks 11–30). (B) Token accumulation on the blue node illustrates the effect on changing the number of runs and stochasticity of the SPN algorithm (X = 100). (C) Modelling multiple inputs into a place. The red node shows two places feeding into a downstream place via a transition node where flow is determined by the upstream node with the least number of tokens. Input to the green node is via separate transitions; token accumulation is additive. (D) Modelling multiple outputs from a place. In the first instance, where output from the blue node is via a single transition, the yellow downstream node receives the same number of tokens as was present on blue, i.e., flow is conserved. When outputs are split from the node itself, token output is distributed equally amongst downstream nodes (purple). (E) Negative feedback loops. In the first case, a non-competitive inhibitor edge (i., red edge with a flat bar) will completely stop token flow through the target transition if any tokens are present on the inhibitor node. By contrast, competitive feedback edge (ii., red edge with an open diamond end), the number of tokens on the inhibitor node are subtracted from the number of tokens flowing through the target transition. An additional factor in determining flow through a negative feedback loop is the number of steps between input and feedback. The more nodes present between feedback receiver and inducer, the more tokens accumulate in the system, resulting in a longer wavelength of the feedback and a greater amplitude of token flow, as illustrated here by the differences between 1, 10, and 50 nodes between signal input and inhibitor. All token flow plots are shown as mean (darker line) with standard error (lighter area around line).

