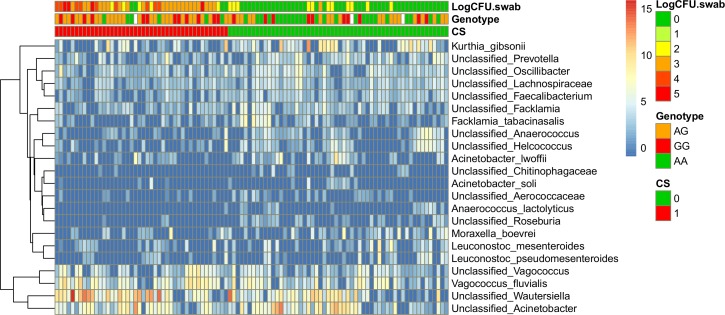
Fig 1. Heatmap of OTUs with significantly different abundance (adjusted p-values<0.05) between pigs S. aureus carriers and non-carriers according to their carriage status (CS = 1 and CS = 0 respectively).
The genetic background (AA, AG and GG) and nasal loads in the first sampling point (LogCFU.swab) are also annotated. Values in the figure and legend correspond to the variance-stabilizing transformation (VST) of the original count data calculated with DESeq2.

