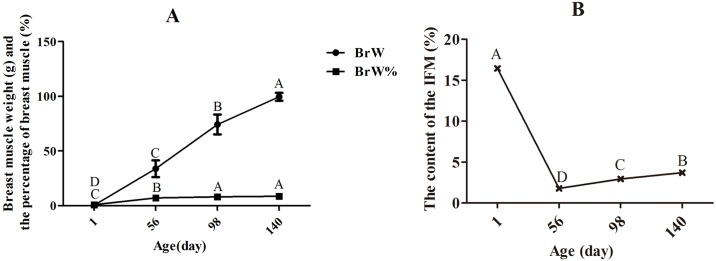
Fig 1. Changes in muscle growth and fat content in breast muscle at different ages.
The data were analyzed by using one-way ANOVA and multiple comparison, and the results were shown as means ± SD. There are no bars on BrW % and IMF % because the SD was smaller than the symbols. (A) Changes in breast muscle growth with age. The weight and percentage of breast muscle (BrW, BrW%) increased significantly (P < 0.01) before day 98, but there was no difference in the percentage of breast muscle between days 98 and 140. (B) Content of IMF increased significantly (P < 0.01) after day 56, but was significantly higher at hatching than at other ages (P < 0.01).

