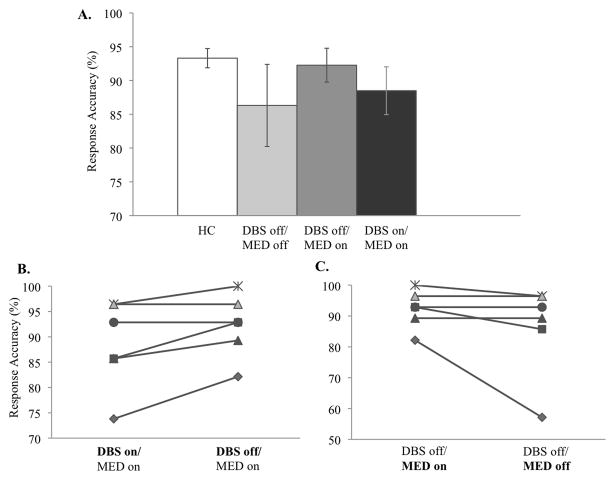
Figure 3.
Behavioral performance. (A) Response accuracy in healthy controls (= HC, N = 8) and PD patients (N = 6) who were tested in three conditions. (B) Individual performance in conditions DBS-on/MED-on and DBS-off/MED-on. (C) Individual performance in conditions DBS-off/MED-on and DBS-off/MED-off. Each line represents data of one patient. The same symbols are used for a given patient in Figures 3B and 3C. Error bars indicate standard error of the mean.

