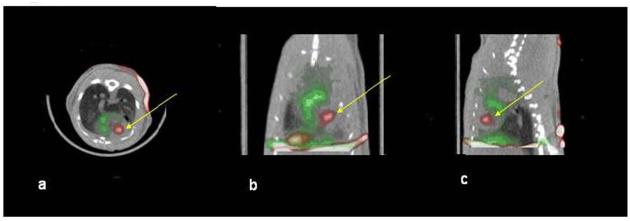
Figure 3. Dual isotope SPECT/CT of an animal injected with hNIS expressing cells.
Red: 99mTc uptake, Green: 201Tl uptake. There is a clear intra-myocardial region (yellow arrow) corresponding to the rCDC injection site within a perfusion deficit. Non-infarcted myocardium appears green due to 201Tl uptake. The liver was also visualized due to uptake of 201Tl. a: transverse, b: coronal, c: sagittal slice orientation.

