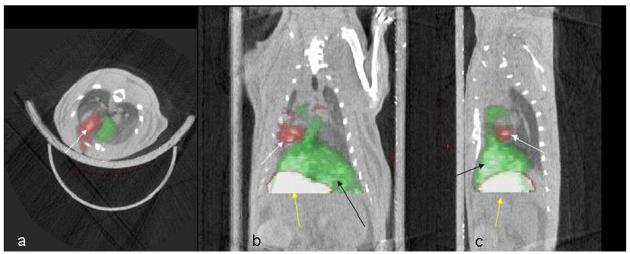
Figure 6. Successful PET/CT co-registration based on the 18fluoride PET images.
Red: 124I uptake. White arrow points to signal from hNIS expressing rCDCs. The stomach takes up 124I and is visualized in the image (yellow arrow). Non-infarcted myocardium and liver (black arrow) take up 13NH3 and appear green in the perfusion scan. a: transverse, b: coronal, c: sagittal slice orientation.

